



Every year the Italian Treasury’s Rapporto sul Debito Pubblico carries a chart with a long title: “Composizione per tipologia di controparte degli ordini portati nelle aste dei BTP nominali da parte degli Specialisti in titoli di Stato” — the composition, by counterparty type, of the orders brought to nominal BTP auctions by the Specialists in government securities. It is a stacked monthly bar chart, seven investor categories in every edition but one, two calendar years per edition, and it shows who was buying around Italy’s nominal BTP auctions. In the 2025 edition it is Figura 5. In the 2016 edition it was Grafico IV.16. The Treasury has published it in every edition in between and has never released the numbers behind it as a table. I read them off the charts, put the result next to what the Treasury says about the same figure in its own prose, and then follow a footnote in the Treasury’s report to where the data come from, which turns out to be a return that fourteen euro-area sovereign debt offices receive in the same format.
What one issuer publishes
The 2025 Rapporto’s sentence beside Figura 5 is the natural place to start, because it gives the Treasury’s own reading of its own chart. In 2025, it says, the participation of banks fell to “una quota sul totale di poco inferiore al 15%”, just under 15% of the total; investment funds rose slightly to “intorno al 32%”, around 32%; and hedge funds rose slightly too, “pari a circa il 42%”, about 42%. The 2016 edition reads the same chart for that year: investment funds “circa il 40%”, banks “in media sul 30%”, on average around 30%, hedge funds “circa il 16%”, central banks “una media del 7%”. Same chart, same issuer, the Treasury’s own numbers at both ends, nine years apart.
The chart is a vector drawing inside a PDF, which means every bar is a filled rectangle with a height, and the height of each segment divided by the height of the column is that category’s share for the month. Decoding ten editions that way gives an annual series for hedge funds of 14.8% in 2015, 16.0% in 2016, then 31.0, 34.1, 40.5, 33.8, 37.9, 33.4, 37.3, 40.8, and 44.4% in 2025. Banks run the other way, from 28.7% to 15.6%. Asset managers are roughly flat, 41.1% to 34.0%.
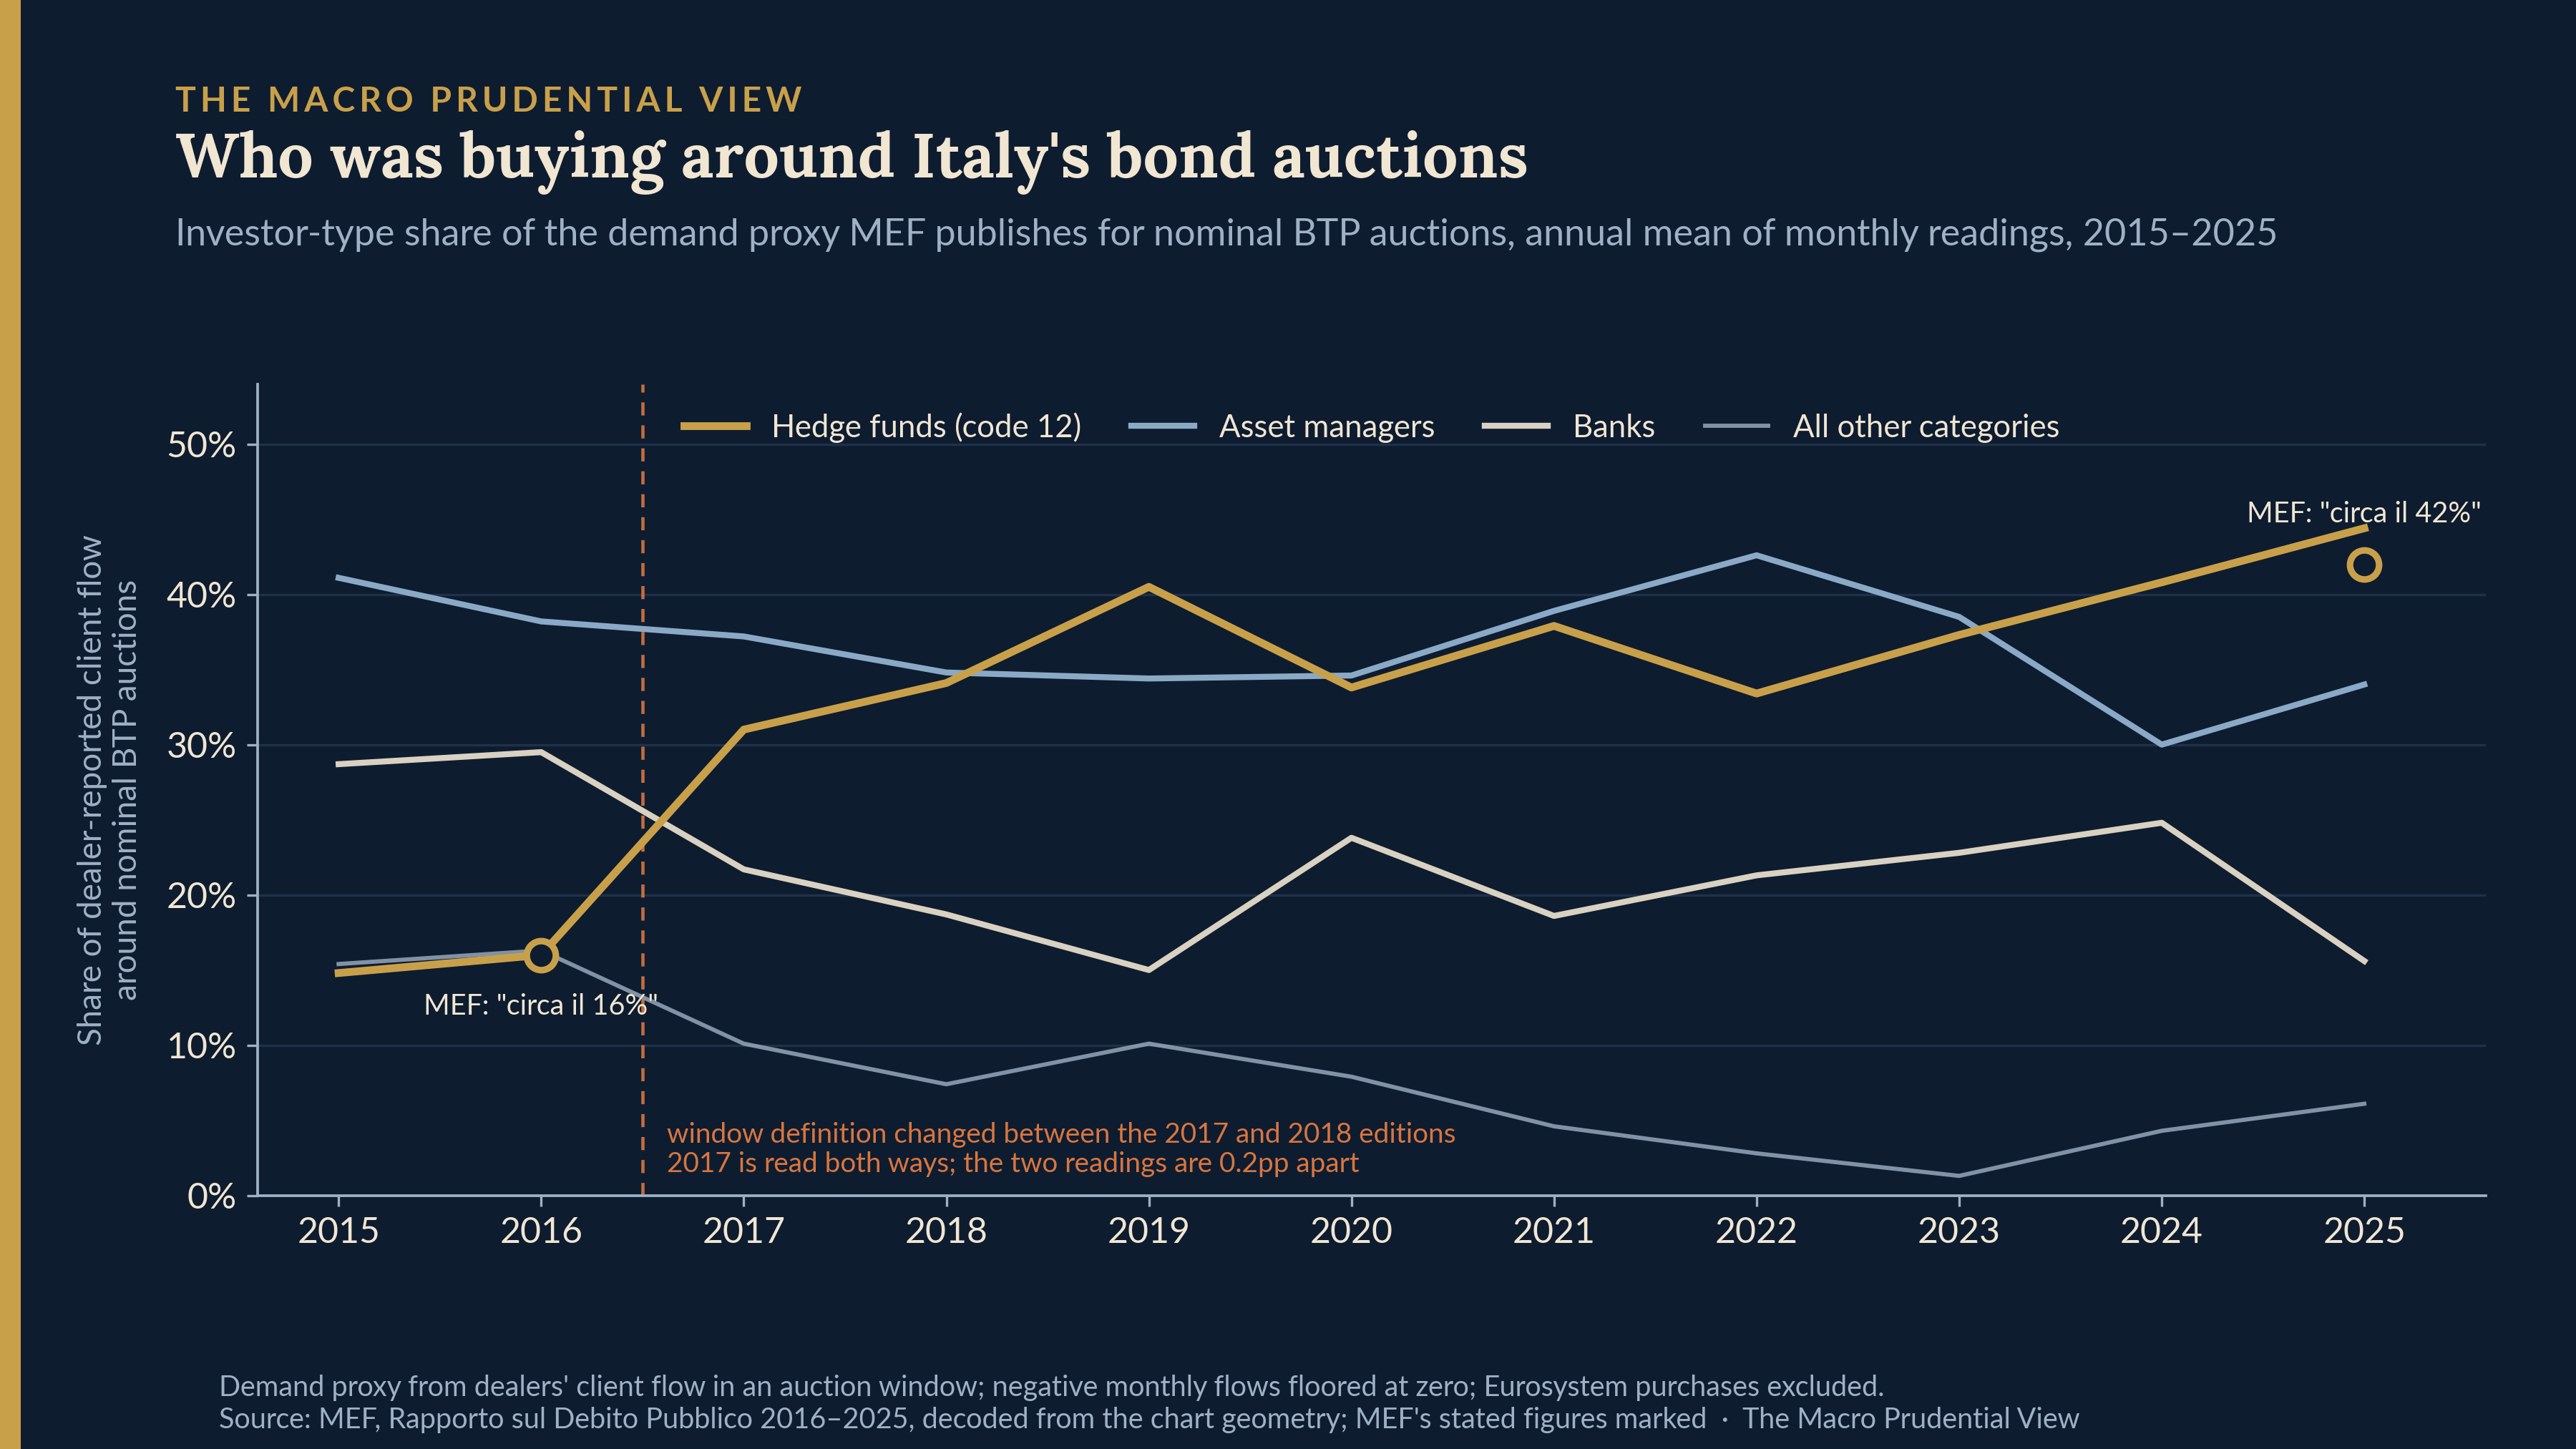
The shape matters more than the endpoints. The largest single-year increase is a fifteen-point step between 2016 and 2017, which is about half of the whole rise from 14.8 to 44.4; the series then runs between 31 and 41% for six years and rises again, by eleven points, between 2022 and 2025. Two movements, then, and the second is not small. The Treasury describes that step itself, in the 2017 edition: a considerable increase in the presence of hedge funds compared with the two preceding years (”il considerevole aumento della presenza di hedge fund rispetto ai due anni precedenti”), matched by a fairly marked reduction in the bank component (”una riduzione abbastanza marcata della componente bancaria”), and it adds that the increase was not only an Italian phenomenon but affected most European countries (”non è stato un fenomeno solo italiano, ma ha interessato la gran parte dei paesi europei”). Two things about that step should be said before it is read as a rise in hedge-fund flow. It is a share, and a share cannot say whether the hedge-fund numerator rose or the bank component of the denominator fell; the 2017 edition does not say which, and 2016–17 was also the period of the Italian banking system’s own stress. The one bank decline the Treasury does explain is the following year’s, which the 2018 edition attributes, “presumibilmente” — presumably — to foreign credit institutions pulling back; it offers no such reading for 2017. And it is the one date at which a change in how dealers coded their clients, or a change in which dealers were in the Specialist panel that reports, would produce exactly this pattern; nothing in the public record rules either in or out. The Treasury’s remark that the rise was not only Italian is quoted as its remark; no second issuer publishes a series that could test it.
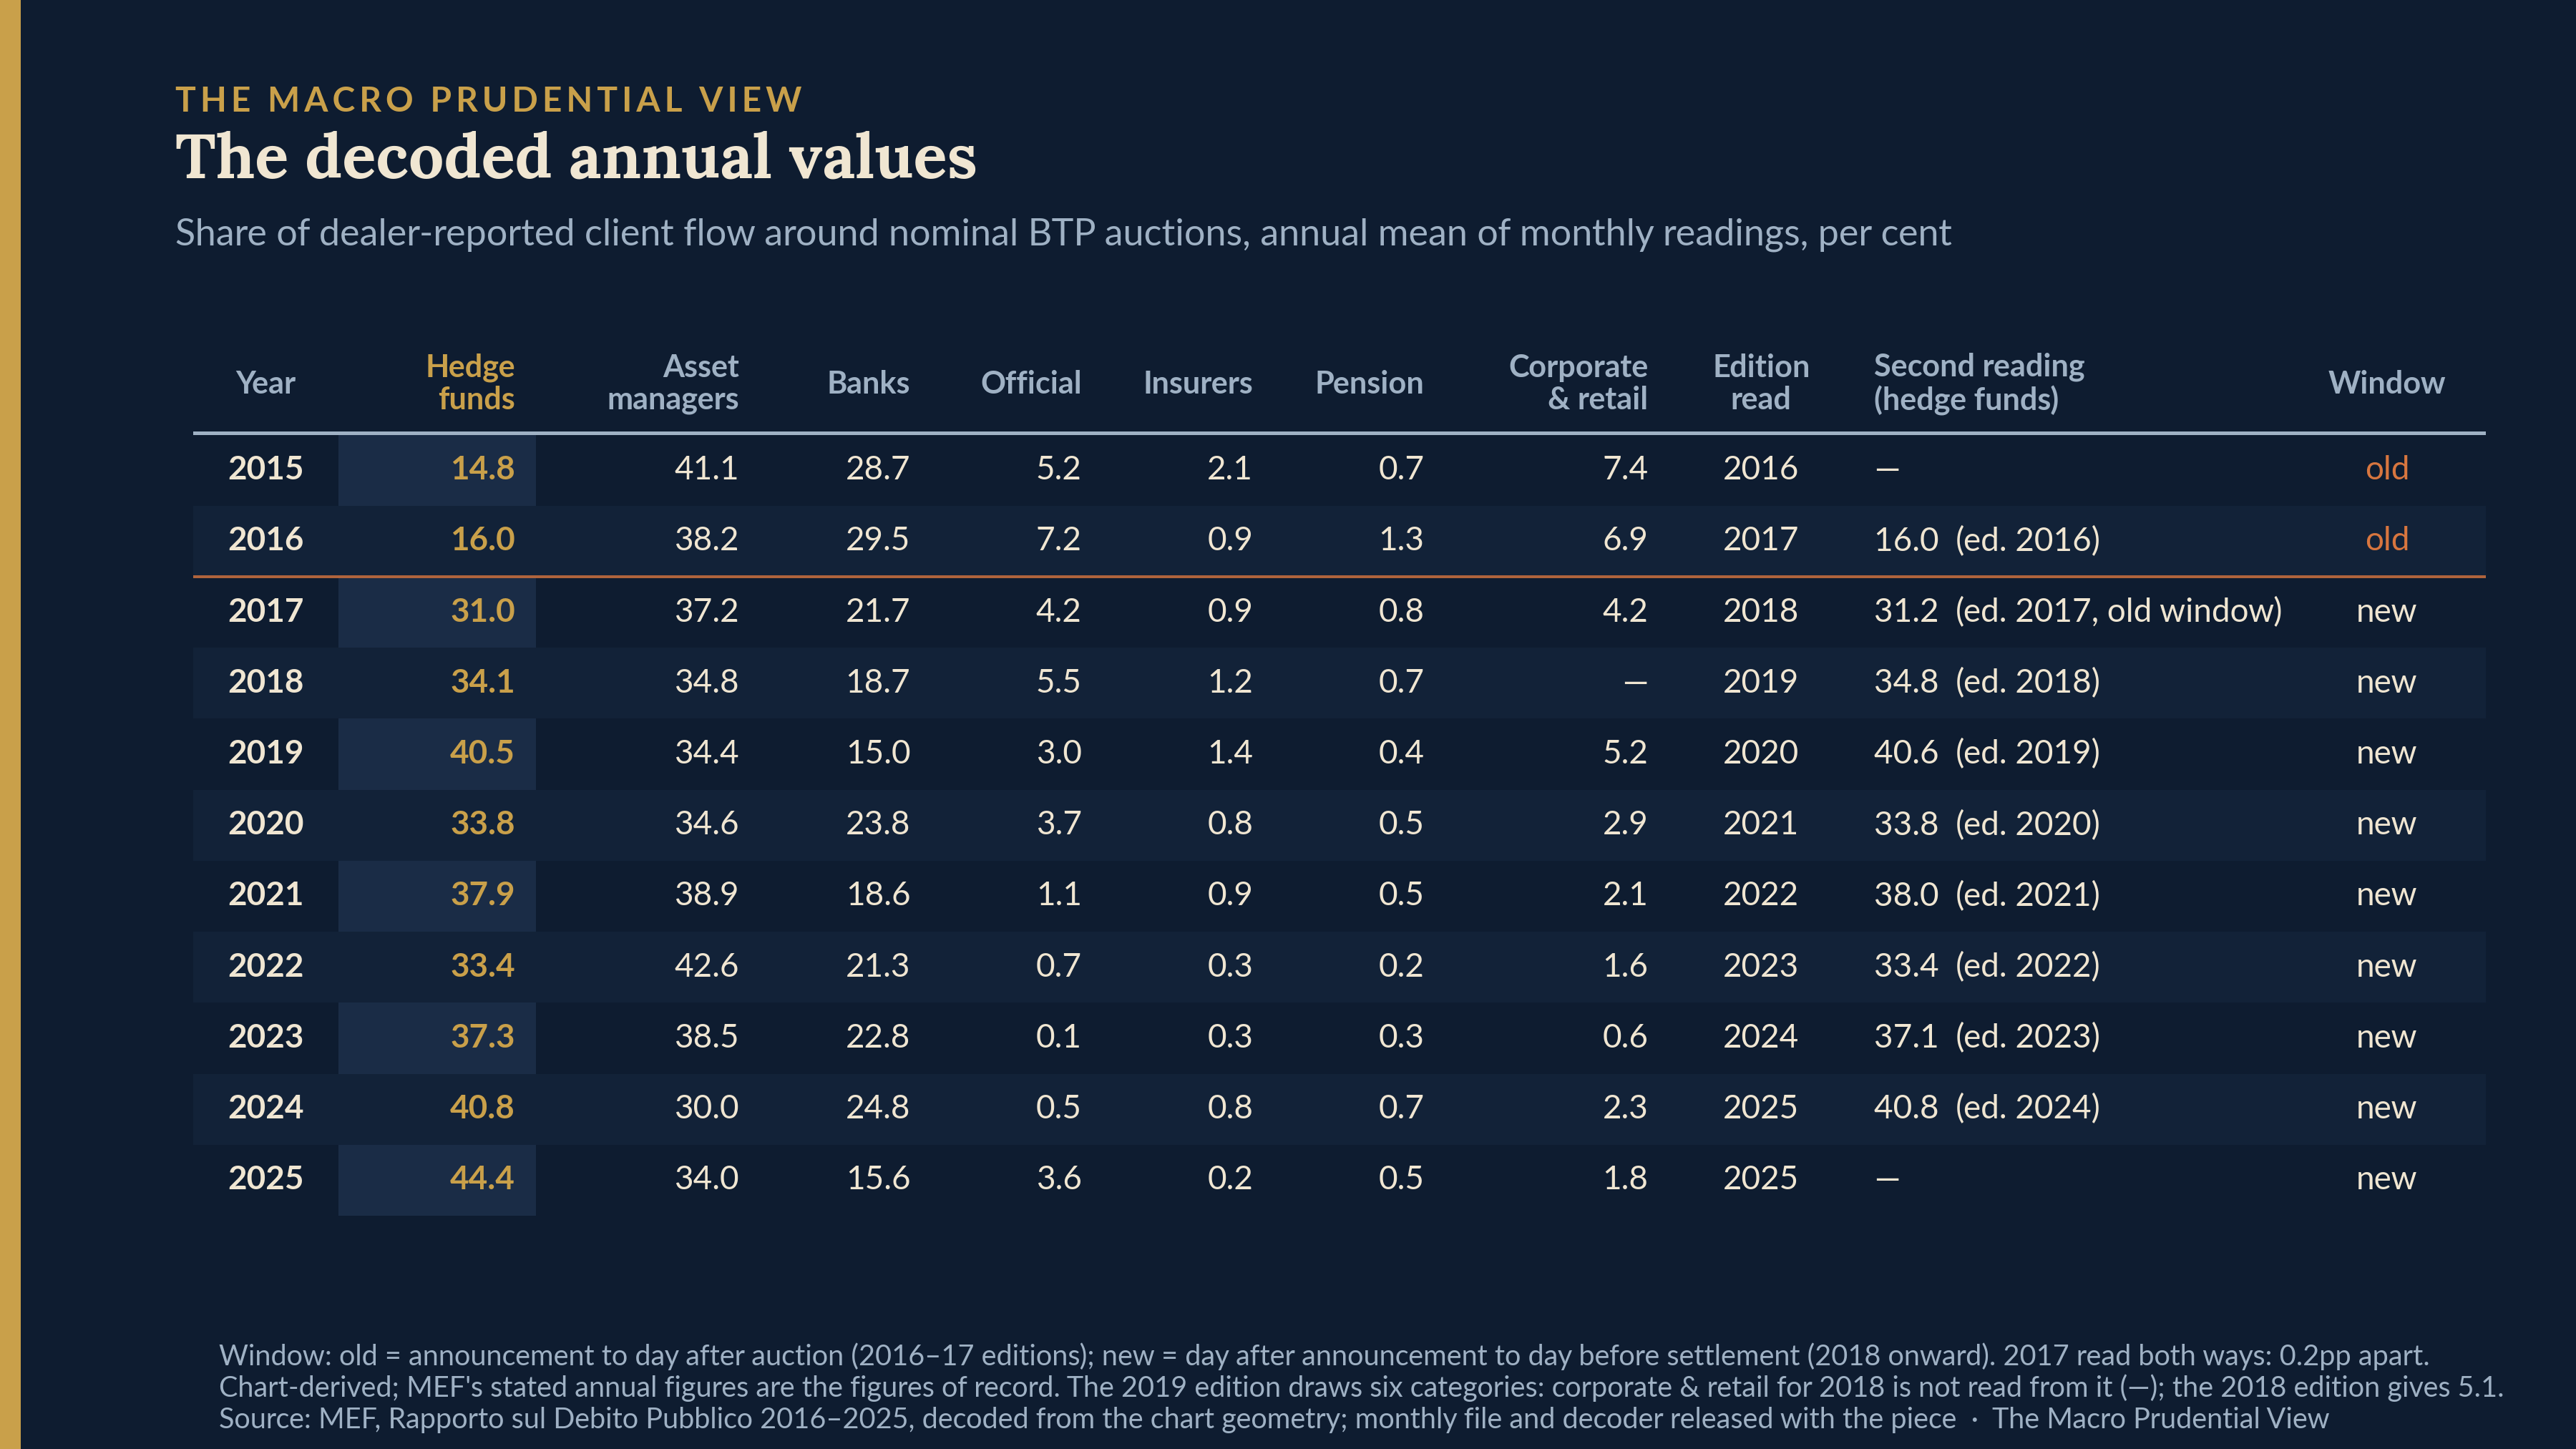
A reader who knows these reports will want two things checked before trusting a chart-derived series, and both can be checked. Consecutive editions overlap by a year, so nine of the eleven years have two independent readings; the largest disagreement between them is 0.7 percentage points. And the Treasury quantifies categories in its prose often enough to test the decode against it: the 2016 edition’s four figures above against decoded 38.2, 29.5, 16.0 and 7.2; banks at 16% for 2019 against 15.0; “circa il 24%” for 2020 against 23.8; “poco inferiore al 24%” and “intorno al 39%” for 2023 against 22.8 and 38.5; “poco inferiore al 25%” and “intorno al 29%” for 2024 against 24.8 and 30.0. The gaps are small and they do not all run the same way: the decode sits below the Treasury’s figure in 2019, 2020 and 2023, on both sides of it within 2016 and within 2024, and above it for all three categories in 2025, by up to 2.4 points in the hedge-fund figure. The Treasury describes its annual figures as shares “sul totale” (of the total) and “in media” (on average) for the year without saying how they are computed, and the decode gives simple means of monthly shares, so the cause of the residual is not established. The figure to quote for 2025 is the Treasury’s “circa il 42%” on the plain ground that it is the issuer’s own annual number; the decoded 44.4 is the reading of its chart. The annual values are in the table at the end and the monthly observations — 240 month-and-edition rows across ten editions, each carrying every category its edition draws, with the edition and window definition for every row — are released with this piece as a data file alongside the decoder, because a measurement piece that will not show its measurements is not one.
There is one methodology change in the series, and it belongs in the text. Between the 2017 and 2018 editions the Treasury altered the window over which it selects the dealer flows: from the auction announcement to the day after the auction, which included the supplementary tranche reserved for Specialists, to the day after the announcement through the day before settlement. The 2017 edition covers 2016 and 2017 on the old definition and the 2018 edition covers 2017 on the new one, so the same year is observed both ways. The two readings differ by 0.2 percentage points. That comparison confounds two things — a different edition and a different window — and cannot isolate the window on its own; what it shows is that the two together move the reading by less than the 0.7 points by which editions on the same window disagree, so whatever the window change did is bounded by ordinary edition noise. It says nothing about dealer panels or client coding at the same date. A documented change with a measured effect is still better evidence than a series with no known change, because it is the difference between an assumption and a test.
Three limits, stated plainly. This is a demand proxy and not a record of bids. The Treasury selects, from its dealers’ returns, the client flows in a window around each auction, and calls the result, in its own words, no more than “una buona proxy della domanda in asta da parte degli investitori finali”: a good proxy for auction demand from final investors. Second, where a category’s flows in a month “siano risultati nulli o negativi”, null or negative, its contribution is set to zero for the chart. That floors a category at zero in the months it is a net seller, which relative to a signed treatment raises it and lowers everyone else. Which category the floor binds on most often is not published. Hedge funds are the plausible candidate, since the Treasury reports their net purchases across its dealers’ whole client book as negative or near zero in most recent years (an overall contribution that “è risultato negativo (-4%)” in 2025) and says they tend “a mantenere un posizionamento neutro alla fine di ciascun periodo contabile”, to hold a neutral position at the end of each accounting period; but that is behaviour over the year, and the incidence of negative months inside the auction windows themselves is not reported. If the floor binds on them, it works toward overstating their share, and the size of the effect cannot be recovered from what is published. Third, Eurosystem purchases are not in the series at all. The reporting format the Treasury draws on excludes “transactions with central banks that are executed within the framework of their monetary policy (i.e. PSPP and PEPP)” from reporting altogether, so the denominator is dealer client flow with the Eurosystem removed.
Where the number comes from
The Treasury’s own footnote says where the flows come from: “le comunicazioni secondo lo schema EMAR, il formato armonizzato adottato dal Sottocomitato ESDM (European Sovereign Debt Markets) del Comitato Economico Finanziario” — the returns under the EMAR schema, the harmonised format adopted by the ESDM sub-committee of the Economic and Financial Committee. Follow it and you leave Rome for the Economic and Financial Committee, whose Sub-Committee on EU Sovereign Debt Markets has run a dealer-reporting standard called the Harmonized Reporting Format since a decision of 8 December 2004.
The format is quoted here at length because the institutional point rests on it and on nothing else. Every primary dealer appointed by a participating debt office files a monthly XML return with that office, one row per transaction. The row carries the trade date, “according to the calendar trade date (T)”; the ISIN; the direction, B or S, from the dealer’s perspective; the nominal quantity, to two decimals; the counterparty’s country of incorporation; the trading system, from a list of fourteen; the value date; and the counterparty type. The documented 2022 version of the format lists thirteen counterparty type codes: Inter Dealer Broker, Bank-Primary Dealer, Bank-Inter Dealer, Bank-Connected Entity, Bank-Customer, Debt Management Office, Public Entity, Pension Fund, Insurance Company, Fund Manager, Hedge Fund, Retail, Corporate. Hedge Fund is code 12. Code 2 is missing from the sequence because “Bank-Own Account” became obsolete in January 2012. That is why this note says the architecture dates from 2004 rather than that the category has been measured continuously for twenty-two years: the taxonomy has changed at least once.
Which rows are which also needs stating, because a supervisor will ask. Under code 7, Debt Management Office, the reported trades “include all primary market transactions (auctions, taps, syndications) and buy backs” and “all the amounts bought by the reporting PD in the framework of auctions, including non-competitive bids”. Those rows are the dealer’s own purchases from the issuer. The Italian series is not built from them; it is built from the dealer’s trades with its clients, falling inside a date window around each auction, and what makes that construction possible is simply that the trade date and the counterparty type sit on the same row. How the Treasury folds the format’s thirteen codes into its chart’s seven categories is not published, and the correspondence used here is inferred from the names: “Fondi Hedge” is taken to be code 12, “Fondi gestione” code 11, “Fondi pensione” and “Compagnie assicurative” codes 9 and 10, “Corporate & Retail” codes 13 and 14. Which of the format’s four bank codes make up “Banche”, and where the chart’s “banche centrali ed altre entità pubbliche” sits in a format whose public-sector codes are Debt Management Office and Public Entity and which names no central bank, are the two places the inference is weakest, and neither touches the hedge-fund category.
The sub-committee does something with these returns, and it is public. Each quarter it publishes the Euro Market Activity Report, covering “14 sovereign and 2 supranational securities markets in the euro area”, built from turnover “reported by the dealers to the participating Debt Management Offices in their respective markets”, collected “on a trade by trade basis”, with primary-market activity inside the totals. The report’s first table is headed “Counterpart type vs counterpart region”. It has two rows: Inter Dealer, and Customer. Where the dealers’ own primary-market purchases from the issuer sit between those two is not visible from the report, only that they are inside the totals.
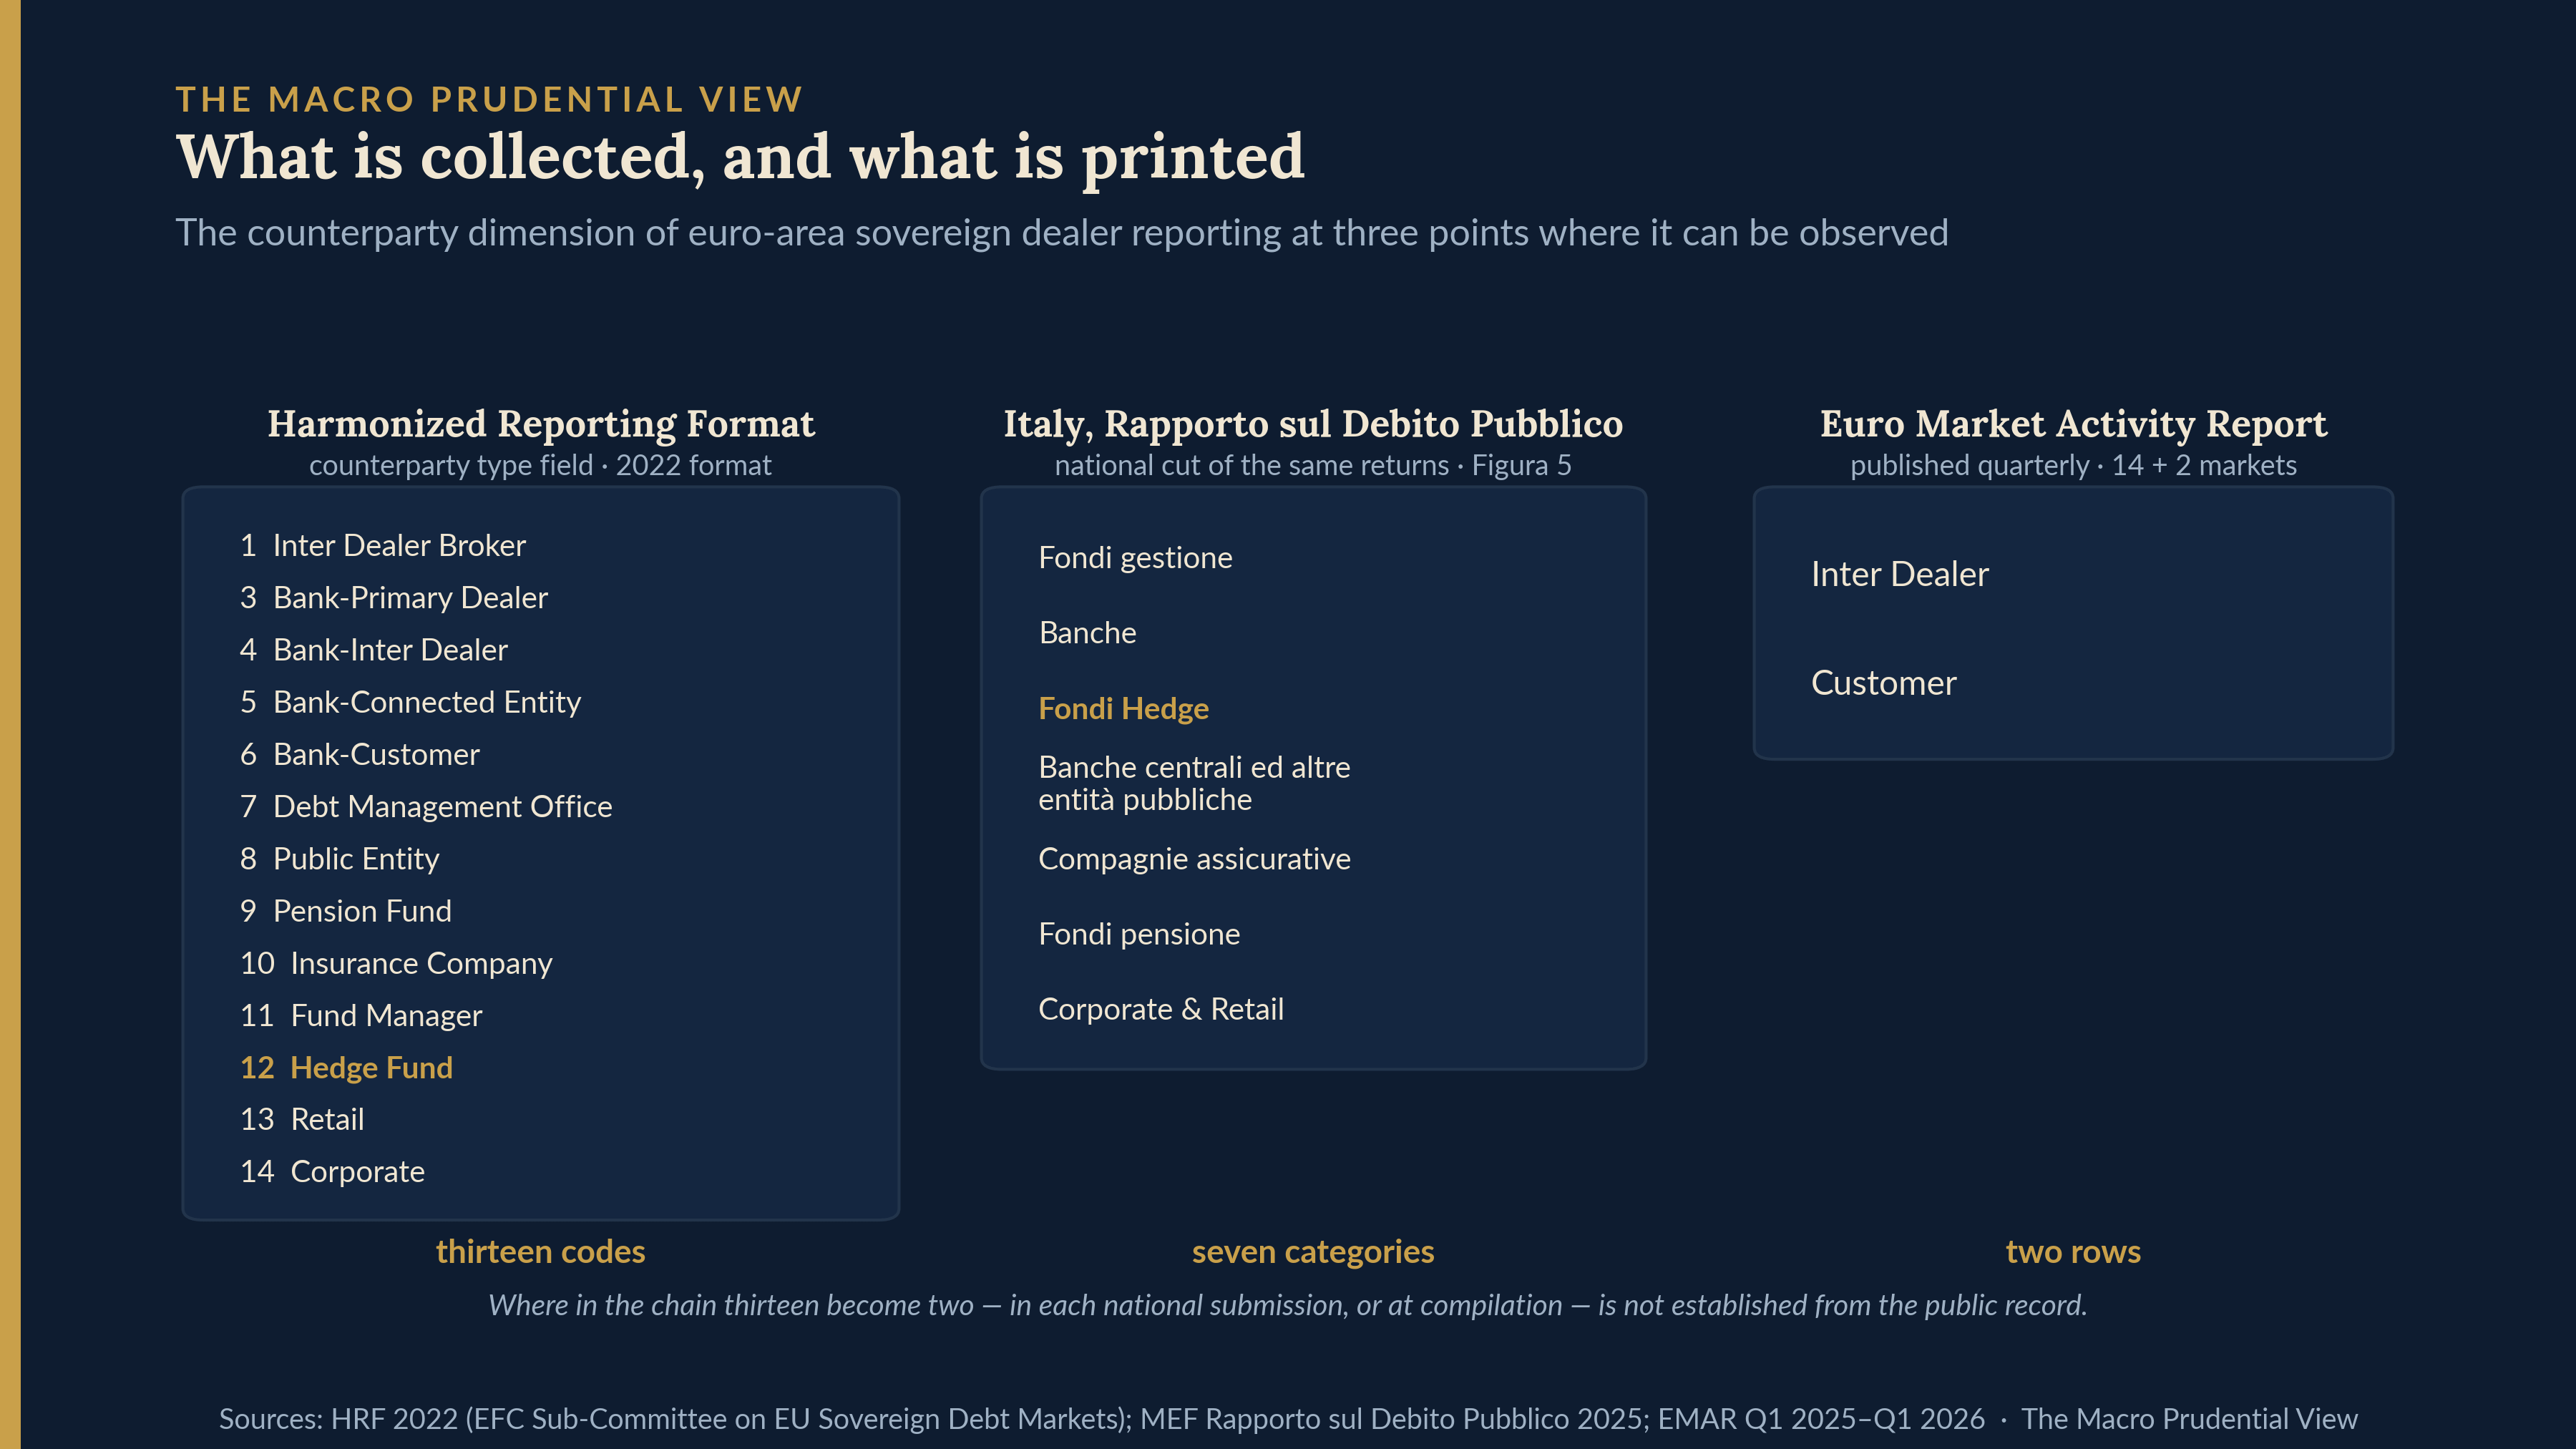
So the Italian series is not a special collection. It is one national cut of a return that every participating debt office receives, and the public euro-area aggregate of that same return distinguishes dealers from everyone else and stops. What I do not know is where the reduction happens: whether the sub-committee receives the transaction-level returns and aggregates them, or receives an already-reduced two-category submission from each office. The published aggregate is what is visible. I have a query with the report’s own mailbox, and will report the answer or its absence.
What can be said about the other offices is narrower than it might sound. Each of them appears to hold the fields needed to construct a similarly structured national cut for its own market, subject to its own dealer coverage, its choice of window, its treatment of negative flows and its instrument scope. Whether two such cuts would be comparable across markets is a separate question and this note does not answer it.
What would have to be true
The principal limitation goes first, and it concerns the category. Throughout, the result is the share the Italian Treasury assigns to code 12. The format describes no validation of the counterparty type a dealer assigns against the legal form of the client, and none is visible from outside, so a rising code-12 share is consistent with dealers recoding relative-value accounts as well as with a change in who is actually trading, and nothing in the public record separates the two. Three things would: the coding instructions or validation procedures dealers work to; the dispersion of the code across dealers; or a second issuer publishing the same cut. The one documented change in the series has been measured at 0.2 points, but that is evidence about the window and not about the category. I do not upgrade “the share assigned to code 12” into a claim about the underlying investor population, and a reader should not either.
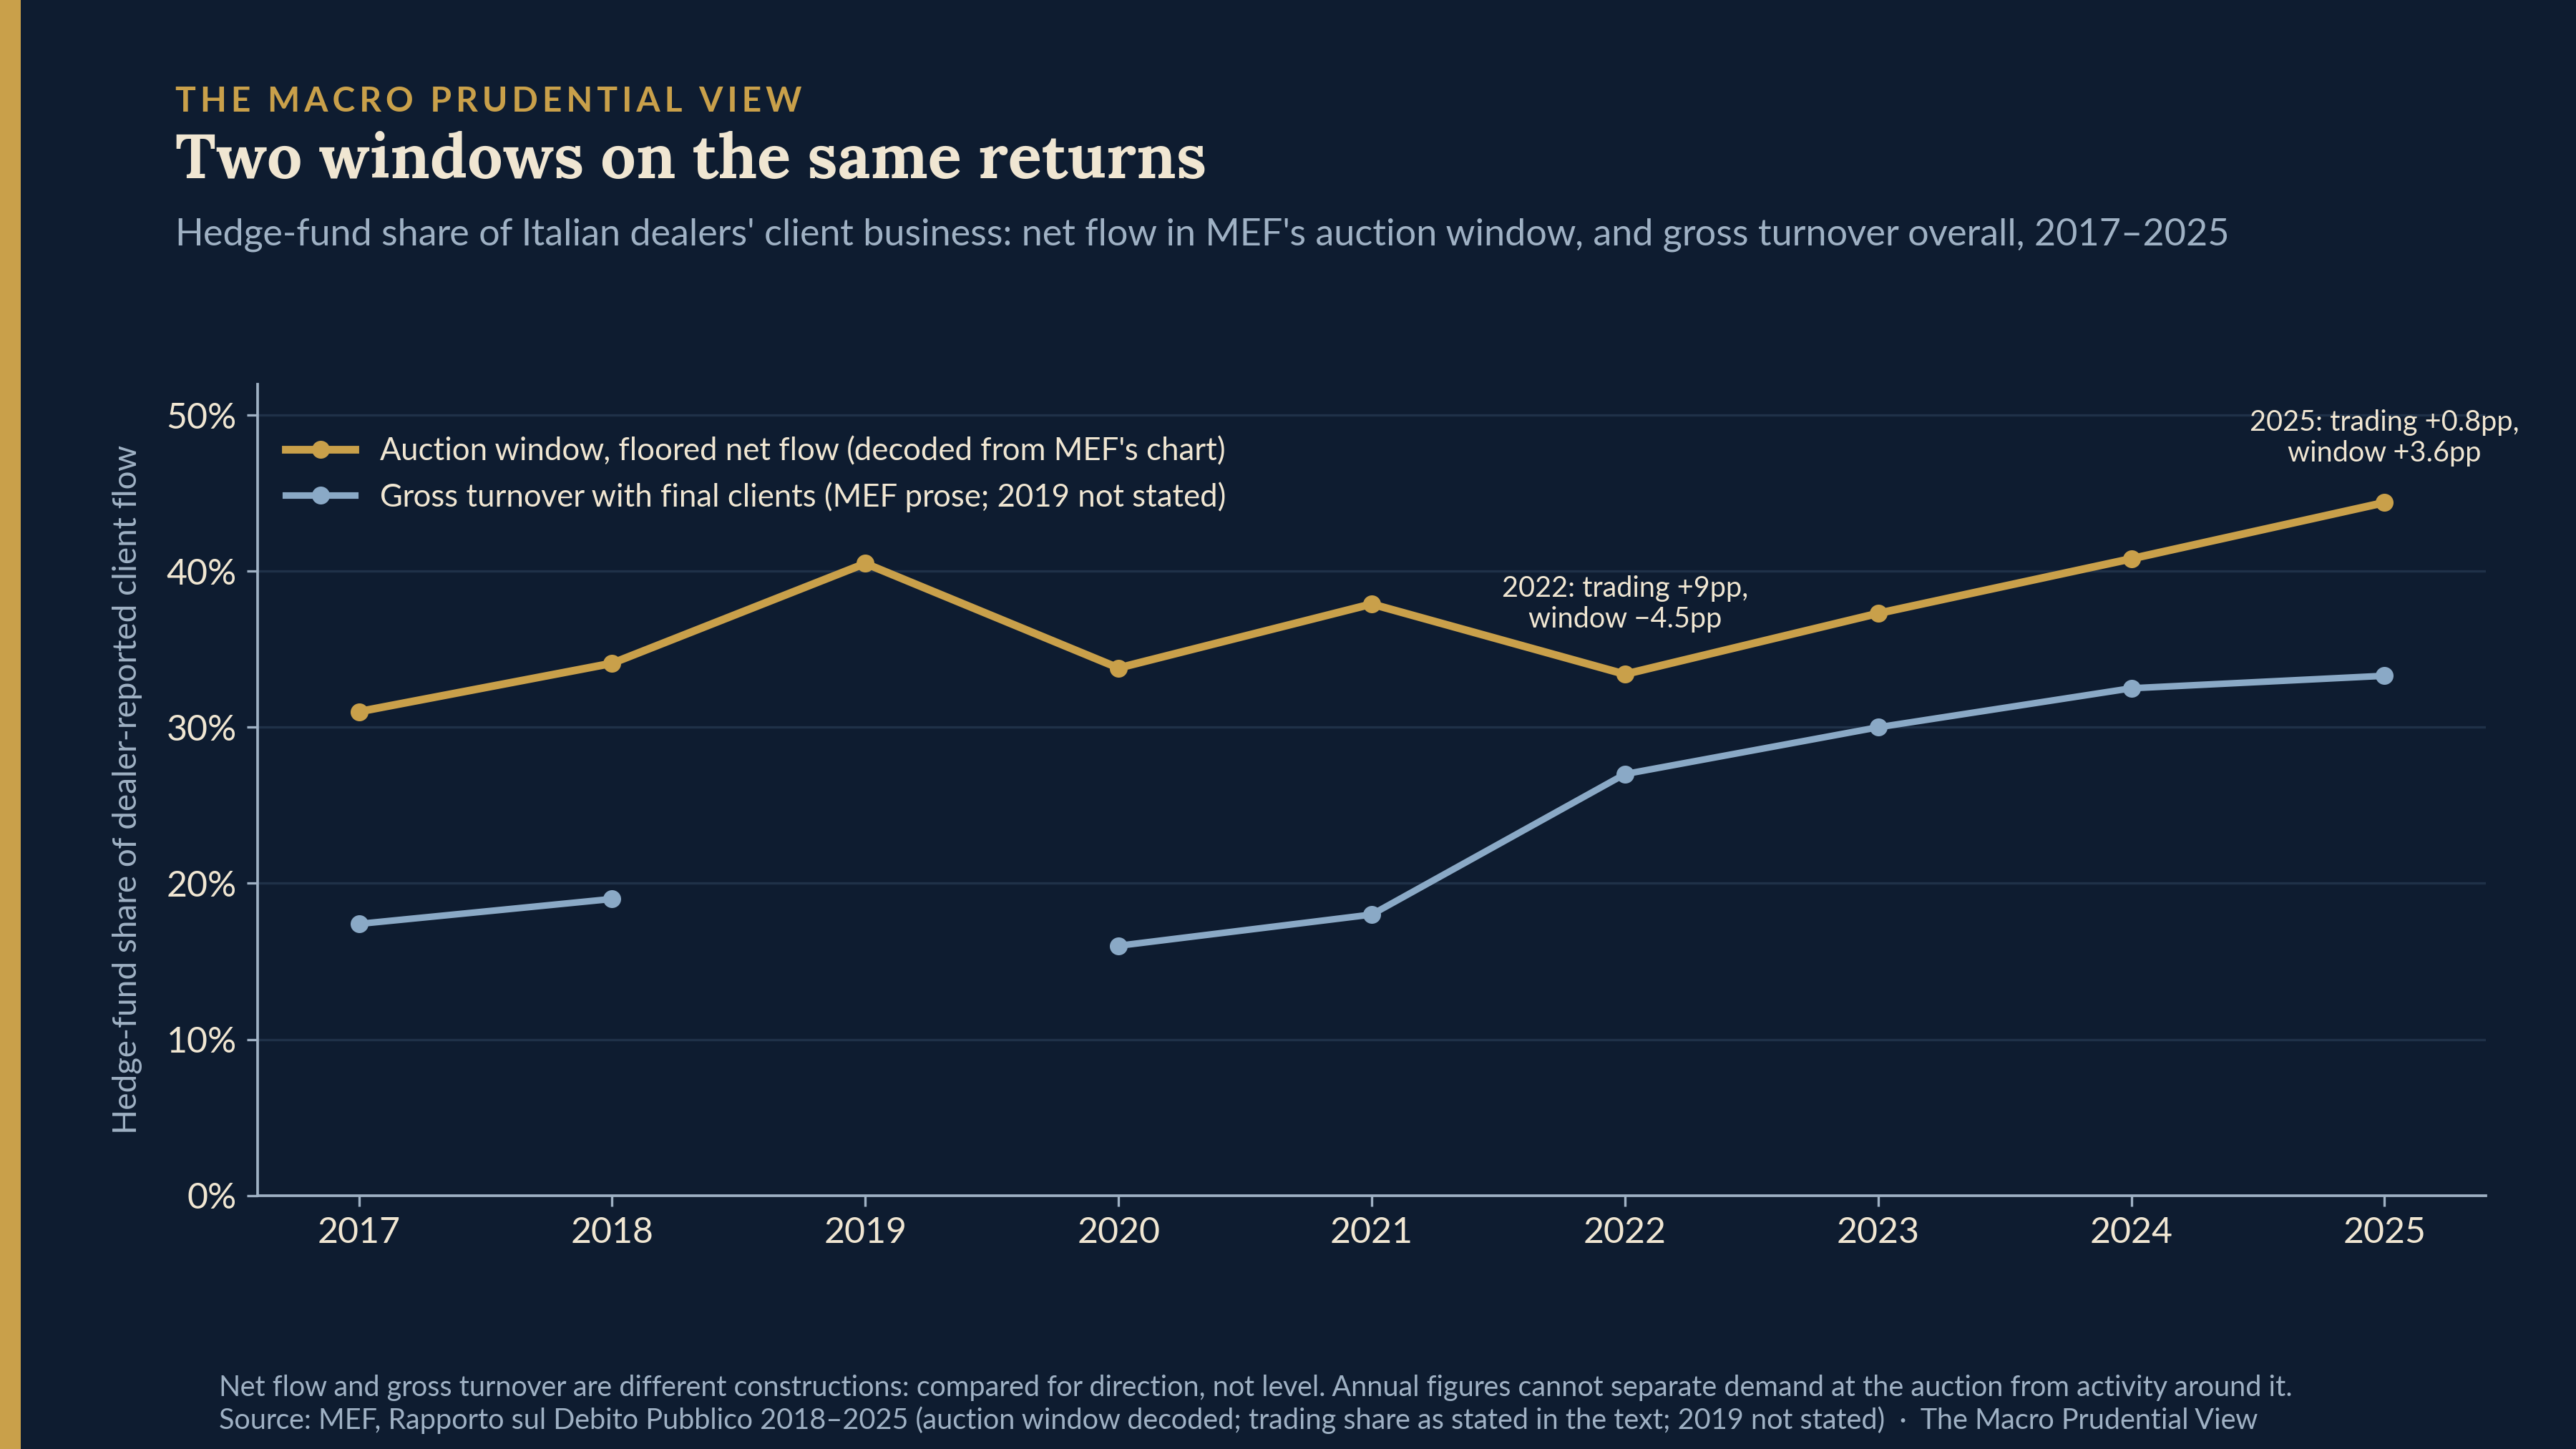
The second question is whether a window around the auction measures demand at the auction or trading near it. The Treasury publishes a comparison series in the same reports, in the section on dealers’ trading by counterparty type, and it is a share of gross turnover — “quota di volumi negoziati”, a share of traded volumes, purchases plus sales — where the auction-window series is a floored net flow, so the two are compared here for direction and not for level: the hedge-fund share of its dealers’ trading with final clients was 17.4% in 2017 and above 19% in 2018 (both stated in the 2018 edition), 16% in 2020 and 18% in 2021 (2021 edition), 27% in 2022, 30% in 2023, 32.5% in 2024 and 33.3% in 2025, each in its own edition; the 2019 figure is not stated in those terms. The two series are not mechanically linked. In 2022 the trading share rose nine points while the auction-window share fell four and a half; in 2025 trading rose under one point against three and a half or more in the window. Across 2017 to 2025 both rise; the turnover share rises further, but gross turnover and floored net flow are different enough constructions that the proportional comparison should not be pressed, and annual figures cannot separate demand that is about the auction from activity that is merely around it. I claim nothing about hedge funds moving toward auctions, and the chart below is there to show the limit rather than to resolve it.
What would make the note wrong, by proposition. The documentary finding fails if the format’s codes are not collected as specified, or if a granular breakdown is published somewhere in the euro-area aggregate that this reading missed. The measurement fails if the decode is wrong, which the table at the end exposes to anyone who wants to check, or if the series is unstable to how the window is drawn, which the 0.2-point test partly addresses. The interpretation of code 12 fails on evidence that dealers assign the category inconsistently.
Where you cannot run this at all
Nine sovereign issuers other than Italy were checked, plus the European Union as a supranational, on the documents examined as of September 2026: France, Germany, Spain, the Netherlands, Belgium, Austria, Ireland, Portugal and Finland. Eight of the nine publish the order book as a scalar and nothing more — a size, an account count, an oversubscription ratio — and every investor-type series they publish is an allotment, a holding, or secondary turnover. Germany is in the eight on the Finanzagentur’s own word: its Transaction Reviews carry an uncaptioned investor-type pie for each syndicated Bund, and asked which side it shows, the agency’s press office replied in September 2026 that the charts refer to the allocation and not to the order book, and that the composition of an order book is not published. For the ninth, Spain, the same is true of everything except one chart whose label does not settle whether it shows allocation or demand; a query is with the Tesoro, and until it answers Spain is unresolved rather than negative. For each of the nine the documents examined were the annual report or review, the funding outlook or programme, the per-syndication results notices, and the investor presentation where one is published; quarterly bulletins and national-language variants were not exhausted, and the document list is in the working note released with this piece. Agence France Trésor is representative: total demand as a single number, then the breakdown of what was allocated. Belgium is the most explicit. Its deal summary for the ten-year OLO 97 of January 2023 reports an order book “in excess of EUR 51 billion” from “over 300 investors”, then two splits of the allocation: by geography, with “85% of the total allocation going to customers outside of Belgium”, and by investor type, with fund managers and bank treasuries at 31% each, central banks and other public entities 17%, banks 11%, hedge funds 5%, pension funds 3% and insurers 2%. Everything after the order-book sentence is allocation.
That finding has a boundary. The Euro Market Activity Report covers fourteen sovereign markets and its published documentation does not name them, so with ten sovereign issuers examined here — Italy and the nine above — at least four of the fourteen are outside this survey, and nothing is claimed about them either way. The formulation is the only equivalent cut found in these ten issuers’ document sets as of this date, and not that no issuer publishes one. Spain’s reading rests on the Treasury’s Chart Pack dated 9 December 2022 — which is the file its website served at the Chart Pack address on 4 September 2026, with a server modification date of 1 March 2023 — and on the Kingdom of Spain presentation of December 2023, whose investor-base section is holdings.
The near misses should be named, because a reader who knows these markets will think of them. Belgium publishes net purchases by investor type. The Netherlands publishes DSL turnover across six dealer-reported categories. Germany’s creditor-structure table is estimated from dealers’ purchases and sales to end investors. All three are dealer-reported, and all three are secondary or stock measures with no anchor to the primary market; whether any of them is drawn from the harmonised return rather than from a national collection is not stated in their documentation, and I do not assume it. What separates Italy’s is the date window, and the fact that its source is named.
What it would be for
A request that a public body publish more because the fields exist is not an argument, so here is the question the categories would answer, stated at the level the data can bear. What is the composition, by investor type, of the client flow dealers report around euro-area sovereign auctions, and how does it move with market conditions? Someone already wants to know. In September 2024 an ECB blog reported an ad-hoc survey of large primary dealers run through the Bond Market Contact Group, finding that hedge funds “now represent over 50% of the total requests received by dealer banks around public debt auctions” in Germany, France, Italy and Spain. Requests received are a different quantity from trades executed, and the returns carry the second; for the same year the Italian auction-window reading of executed net flow is 40.8%, which is what one would expect to sit below a share of requests if requests are inflated relative to fills, though the two are not the same object and the comparison is offered as a juxtaposition. The survey is evidence that authorities want to know the investor composition around auctions, and the returns are the nearest thing to it that already exists every month. A counterparty aggregate with the categories intact could answer that question at whatever level of aggregation confidentiality permits; Inter Dealer versus Customer cannot, because that split puts a pension fund and a hedge fund in the same row. The Italian series is the demonstration that the question has content: the share moves, by a lot, and the two-row aggregate could not show that it moves. What the categories would not deliver should be said too. They are a share of a proxy, which is what the Italian chart is, and neither bids, nor leverage, nor a measure of concentration.
The likeliest reason the published aggregate has two rows is not oversight. It is some combination of cell confidentiality across fourteen markets of very different sizes, and the comparability of a category that each dealer assigns for itself — which is the same objection that makes the Italian series a measure of code 12 rather than of hedge funds. Those constraints are real. A note that pretended otherwise would deserve the answer it got.
The question
So the ask is a question, and it is addressed to the sub-committee as the committee of debt management offices: what is the constraint? Thirteen codes in the reporting format. Two in the published report. One national cut that keeps the categories, published every year for a decade by an office that receives the same returns as the others. If the reduction is confidentiality, the useful answer says at what level of aggregation it binds. If it is comparability, the useful answer says what would have to be true of dealer coding for the categories to be published. Either is more than the current position, in which the question has not been put in public.
The number every issuer does publish is the one that carries least. After each syndicated bond, euro-area debt offices report how much of it was allotted to each investor type. A hedge fund allotted 1% of a French syndication — the figure in each of Agence France Trésor’s seven syndication results releases from January 2025 to April 2026, dated 21 January, 12 February, 25 March and 29 April 2025 and 14 January, 11 February and 14 April 2026 — or 3.4% of an Italian one, the simple mean of the hedge-fund row across the eight nominal BTP syndications in the Rapporto’s Tabella III.5, may have asked for a great deal or for very little, and the published record does not say which. There is no published denominator. The reporting format the fourteen offices receive carries the fields from which a proxy of the kind Italy builds for its auctions could be built, and nine of the ten offices examined here print nothing of the sort. The tenth prints a different cut of the same return instead. That is a proxy for auction demand, which is what has been shown; no equivalent has been shown for syndications. Whether the two supranational issuers in the report receive the same transaction-level file is not stated in the public documents, and nothing here is addressed to them.
Annual values, decoded
Paweł Fiedor — The Macro Prudential View
Views are my own. This article is a personal analytical piece based on public sources. It does not represent the views of the European Systemic Risk Board, the Central Bank of Ireland, the Eurosystem, or any other institution.
Italian Treasury
Ministero dell’Economia e delle Finanze, Dipartimento del Tesoro, Rapporto sul Debito Pubblico, editions 2016 to 2025 — the auction-order chart (Grafico IV.16 in the 2016 edition, Figura 5 in the 2025 edition) and the prose beside it in every edition; the footnote naming “lo schema EMAR”; the window definition in the 2017 and 2018 editions; the zeroing rule; the hedge-fund share of Specialists’ trading with final clients from the section on trading by counterparty type (2018, 2021, 2022, 2023, 2024 and 2025 editions); Tabella III.5 of the 2025 edition for the syndication allocations. All quotations in Italian are from these documents; translations are mine.
The reporting format and the published aggregate
EFC Sub-Committee on EU Sovereign Debt Markets, HRF 2022 — Harmonized Reporting Format — the decision of 8 December 2004, the fields of the monthly return, the thirteen counterparty type codes, Hedge Fund at code 12, the Bank-Own Account code made obsolete in January 2012, the definition of code 7, the exclusion of PSPP and PEPP transactions.
Euro Market Activity Report, Q1 2025 to Q1 2026 — “14 sovereign and 2 supranational securities markets”, the trade-by-trade basis, and the “Counterpart type vs counterpart region” table with its two rows.
Other issuers
Agence France Trésor, syndication results releases of 21 January, 12 February, 25 March and 29 April 2025, and 14 January, 11 February and 14 April 2026 — total demand, then the allocation by investor type, hedge funds at 1% in each.
Belgian Debt Agency, OLO 97 deal summary, January 2023 — the order book, the geographic split and the investor-type split of the allocation.
Tesoro Público, Chart Pack — the file served at that address on 4 September 2026, dated 9 December 2022 — and the Kingdom of Spain presentation of December 2023.
Dutch State Treasury Agency, Outlook 2026, Figure 12; Deutsche Finanzagentur, Transaction Reviews and the creditor-structure table at deutsche-finanzagentur.de, and the agency’s press office by email, September 2026, on what the Transaction Review charts show; the annual reports, funding programmes, syndication notices and investor presentations of the OeBFA, NTMA, IGCP, the Finnish State Treasury and the European Commission, as listed in the working note.
ECB
Ferrara, Linzert, Nguyen, Rahmouni-Rousseau, Skrzypińska and Vaz Cruz, Hedge funds: good or bad for market functioning?, The ECB Blog, 23 September 2024 — the Bond Market Contact Group’s ad-hoc survey of large primary dealers and the “over 50%” figure for Germany, France, Italy and Spain.
Data and code
github.com/pafiedor/tmv-data/code12 — the 240 monthly observations with edition and window for each row, the annual table, the window-versus-turnover series, the decoder, and the survey note.
Calculations. The chart is decoded from the PDF’s vector content: each bar segment is a filled rectangle, and its height divided by the column’s height is the category’s share for the month. Annual values are simple means of the twelve monthly shares, with a category that draws no segment in a month counted at zero, which is the Treasury’s own treatment of null or negative months. Where two editions draw the same year the later edition is used and the earlier reading is shown beside it. The Treasury’s stated annual figures, where it gives them, are the figures of record; the decoded values are readings of its chart. The 3.4% syndication figure is the simple mean of the hedge-fund row across the eight nominal BTP syndications in Tabella III.5 of the 2025 Rapporto. Translations from the Italian are mine.