


The IMF published its 2026 review of the Financial Sector Assessment Program on 22 September, after the Executive Board discussed it on 3 September. Most of the paper is about making the programme more agile, with more voluntary assessments and modular scopes. One part changes who has to be assessed and how often. The list of jurisdictions with systemically important financial sectors, which carry a mandatory assessment, falls from 47 to 42. The group on the five-year cycle falls from 32 to 21, plus the euro area as a whole.
Five euro-area members move from five years to ten: Austria, Finland, Greece, Ireland and Portugal. The paper changes several parts of its method at once, so the list alone does not say which change moved whom. This note uses the paper’s own tables and a rebuild of the method on public data to separate the higher clique bar from the discount. For three of the five, on the rebuild, the discount plays no part. For Ireland, and less robustly Austria, it decides the move.
What changed
The IMF identifies systemic financial sectors with a network method (Annex V). It builds bilateral networks of cross-border exposures: portfolio debt, portfolio equity (including fund shares), banking claims and liabilities, and a fourth network of equity-price correlations. Each pair’s exposure is weighted by the two jurisdictions’ shares of world GDP and scaled by each side’s total. Links above a threshold count. A jurisdiction goes on the five-year cycle if it belongs to a clique, a group in which every member is linked to every other, of a given size in any one network.
The 2026 Review changes four things (para 62). The clique needed for the five-year cycle rises from five to six. Exposures between two euro-area members are discounted “by 67 percent”, that is, counted at one-third. Averages run over ten years, and GDP weights are nominal rather than PPP. Staff judgement then adds Belgium, Luxembourg and Sweden for their market infrastructure and Saudi Arabia for data gaps (para 61).
The paper is explicit that the result is not a size ranking. The definition “is not a proxy for a jurisdiction’s overall importance” (para 56). Chart below uses the paper’s own size memo to place the three large fund domiciles, Ireland, Luxembourg and the Cayman Islands, on the new list.
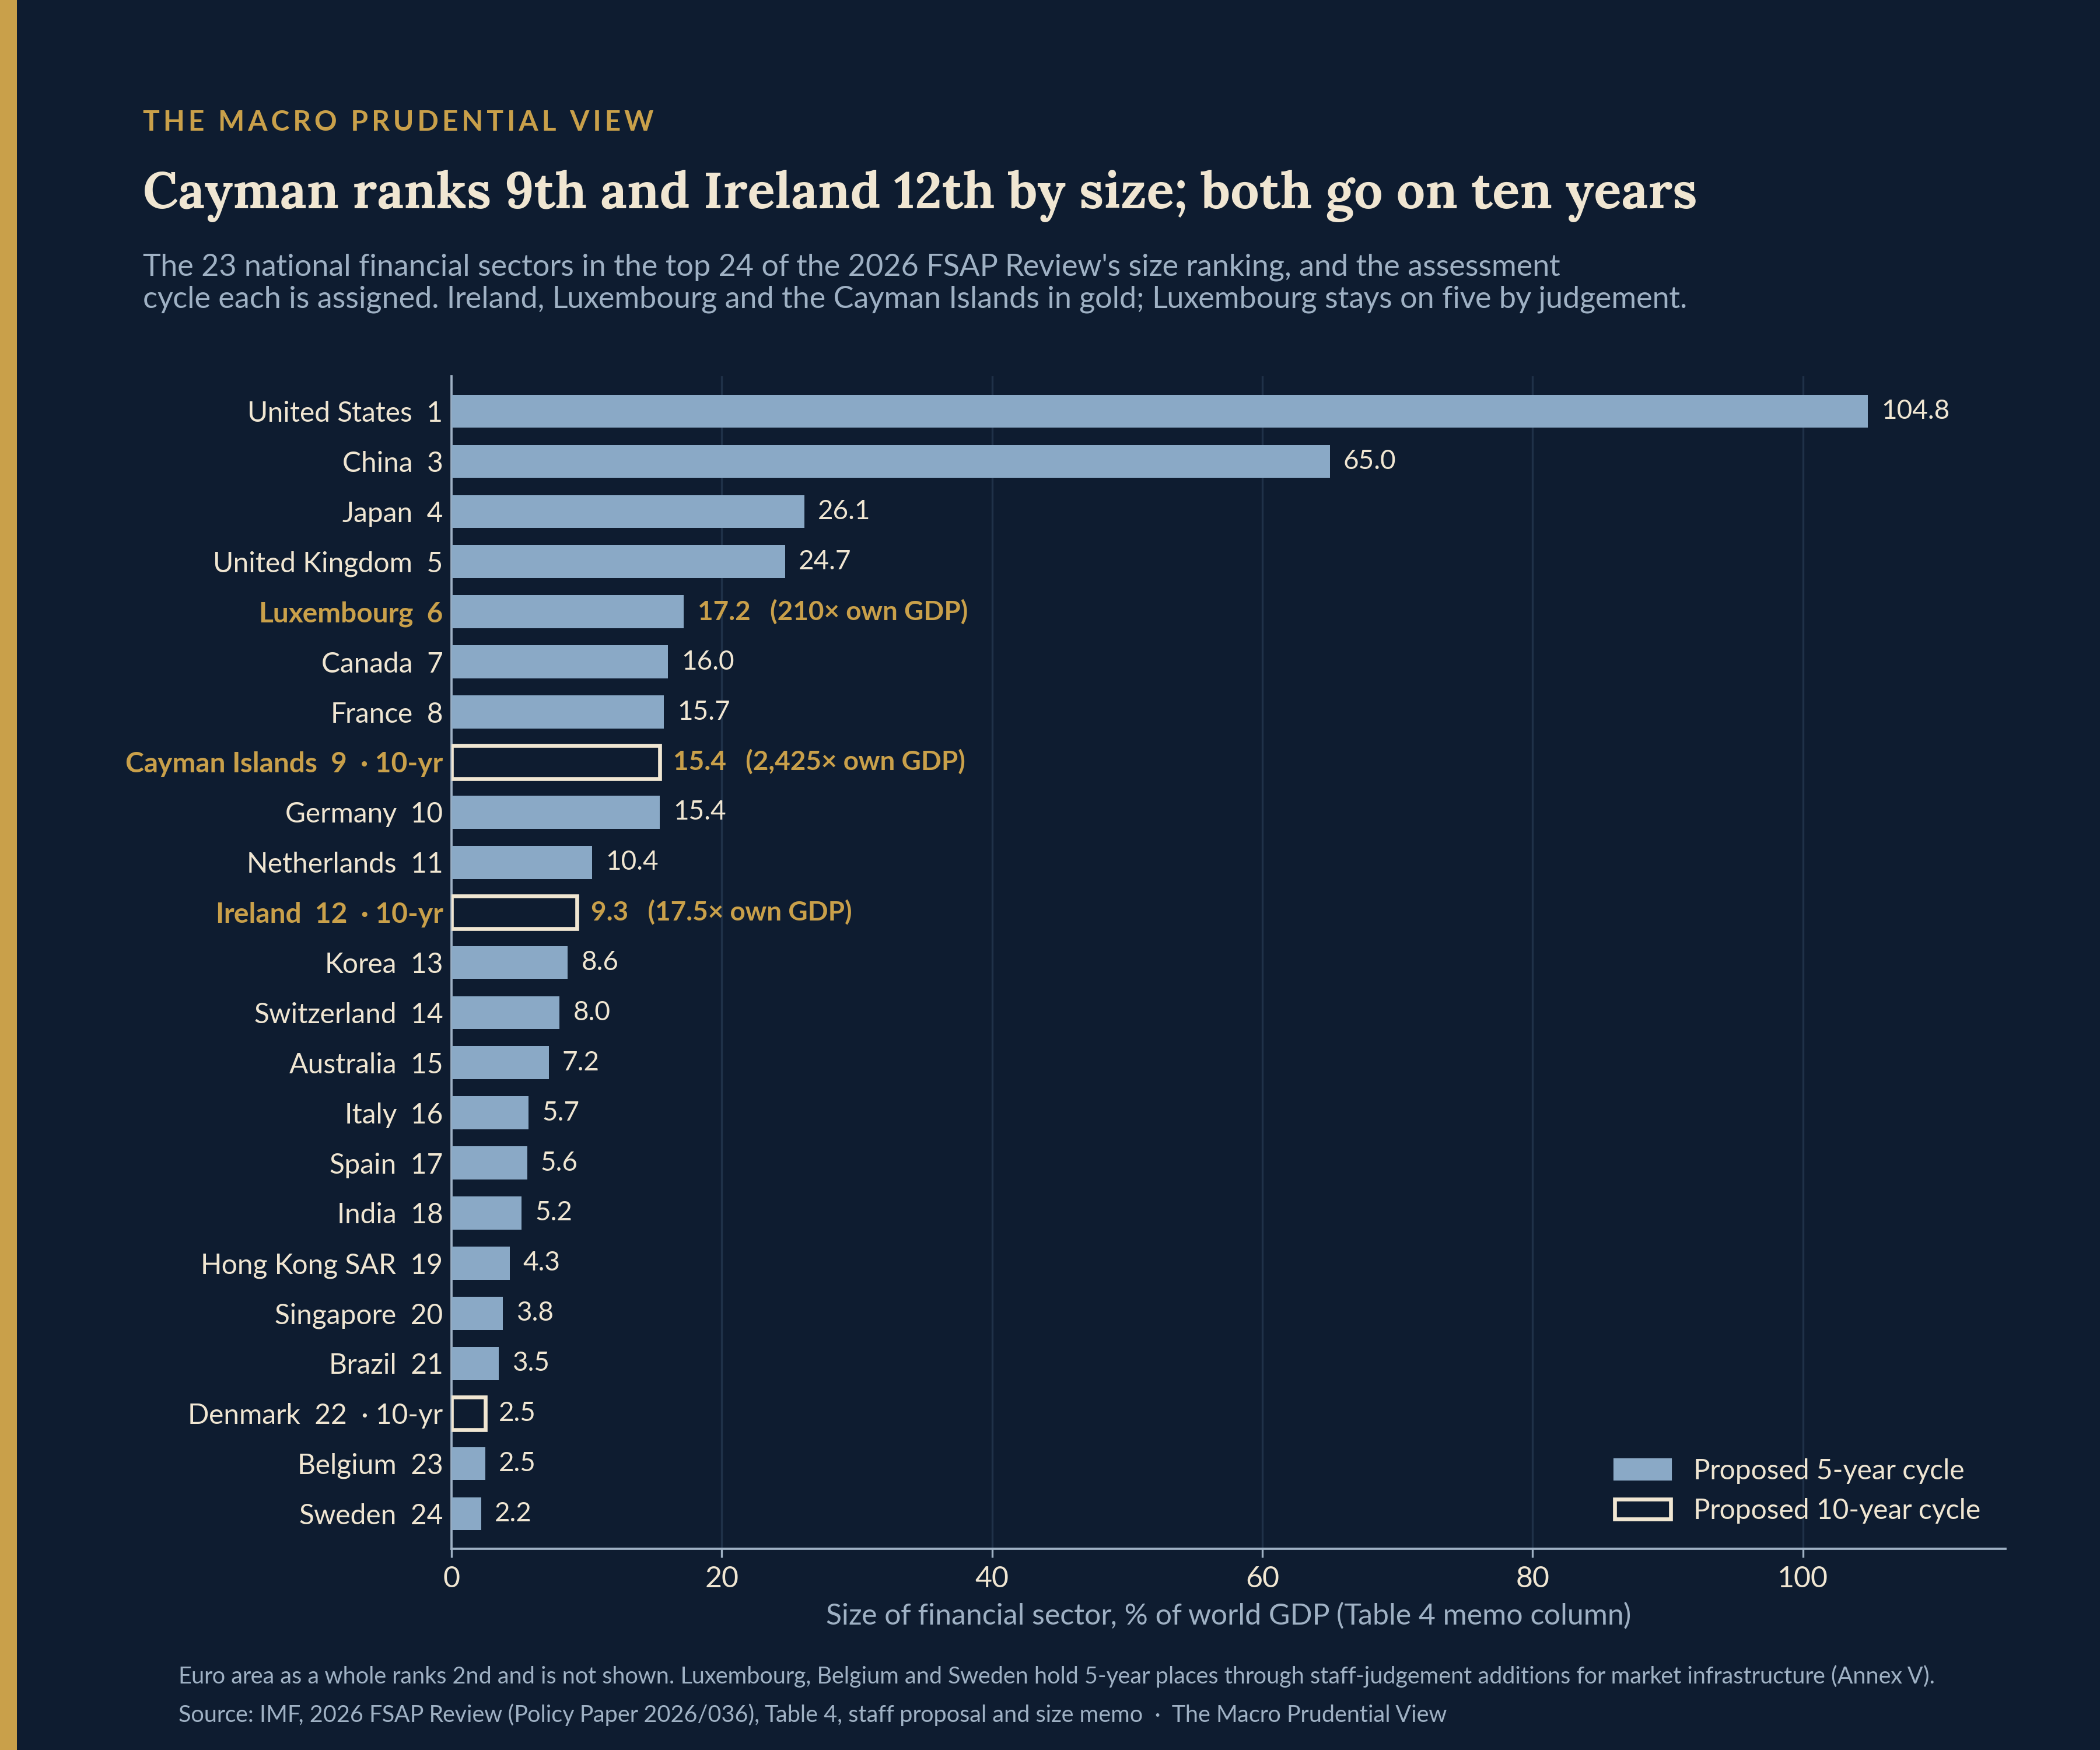
Ireland moves to ten years, and the Cayman Islands join the list on ten. Luxembourg stays on five through the judgement overlay for Clearstream.
Two moves, two causes
Table 4 of the paper carries a robustness flag for each jurisdiction in its size memo. Ireland and Austria are both marked “o”: on ten years at either clique size under the proposal. With the discount in place, then, the paper’s own run keeps them off the five-year cycle even at the old bar of five. What the table does not publish is the other side: where they would stand at full weight.
That is what the rebuild supplies. I reconstructed three of the four networks from public data: IMF Portfolio Investment Positions for debt and equity, and BIS locational banking statistics for banking (reporting banks’ positions against all sectors of the partner country). I used 2015–24 averages, nominal GDP and the Table 2 thresholds as printed. The equity-price network is not rebuilt. Because a jurisdiction qualifies through any one network, a missing network can only add cliques. It cannot remove one the rebuild finds.
On the whole list the rebuild matches the paper’s classifications closely, which is a check on placements and not on clique sizes. It finds 15 of the 17 members the paper places on five years by data (it misses Brazil and India), all 21 of those on ten, and no false five-year placements. Chart below applies it to the five euro-area movers.
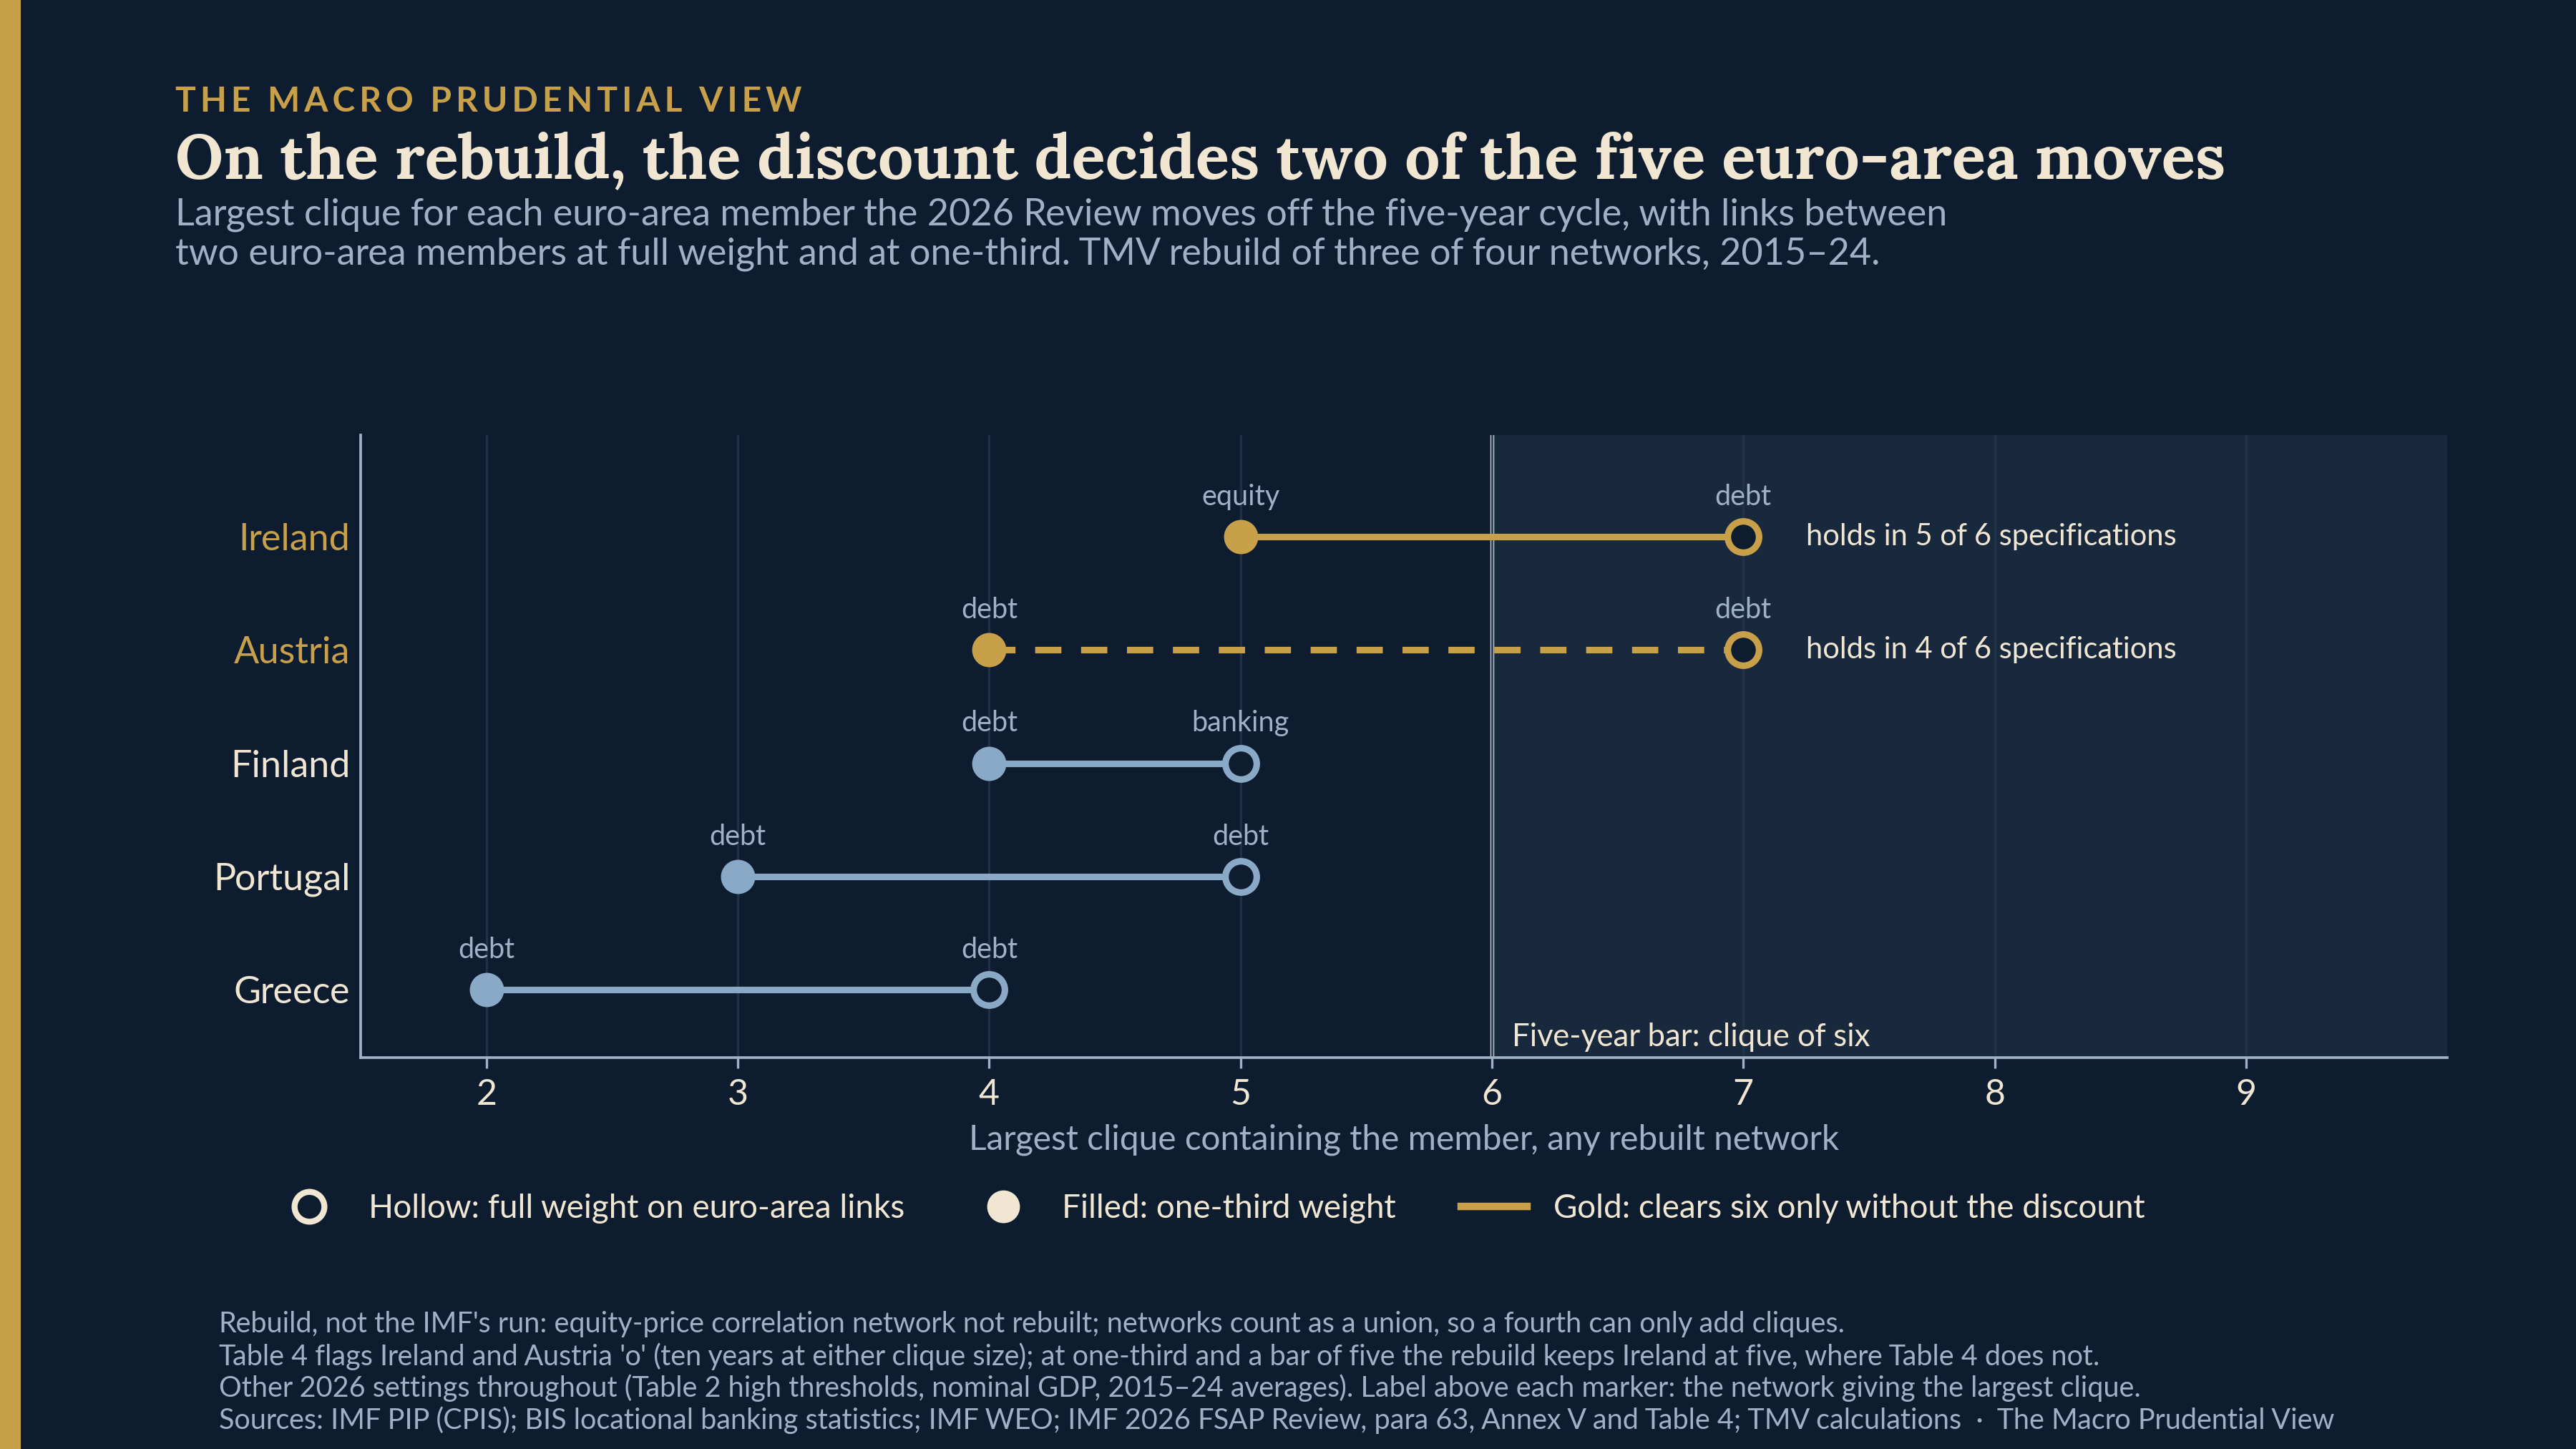
At full weight on euro-area links, Finland’s and Portugal’s largest cliques are five, which the old bar accepted and the new bar of six does not. Greece’s is four. It reaches five with 2015–19 averages, on either nominal or PPP weights, and four with 2015–24 averages on either. So either the higher bar or the longer averaging window is enough to move it. None of the three is a discount case.
Ireland and Austria each sit in a clique of seven at full weight, both in portfolio debt, and Ireland also reaches six in equity and in banking. At one-third, Ireland’s largest clique falls to five (equity) and Austria’s to four (debt). Holding the other 2026 settings fixed, on the rebuild the discount decides the move for these two. That is a result about the rebuild, which the IMF’s published table can corroborate only at one-third weight and which departs from it in one cell (below). Ireland’s full-weight cliques are as large or larger under PPP weights or 2015–19 averages, and it would still qualify under a bar of seven. It keeps a clique of six down to a weight of 0.5 and loses it from 0.4, so the result does not hang on one-third exactly. Austria’s case is thinner. Two of its links in the debt clique, to Spain and Italy, are within 7% of the threshold at full weight, and its result holds in four of the six specifications I tested (below), against five for Ireland.
One disagreement needs stating. At one-third with the old bar of five, the rebuild keeps Ireland in one equity clique (Ireland, Germany, Switzerland, the UK and the US), where Table 4 says ten years. That clique exists only because the Switzerland–UK link sits 0.9% above the threshold. Without that link Ireland’s largest clique is four, and under PPP weights the link falls below the bar. This locates where the rebuild departs from the paper. It does not explain why the IMF’s inputs differ from mine.
Which Irish links cross the bar
A clique is lost when links fall below the threshold, so the next question is which ones. Chart below shows each of Ireland’s links as a multiple of the threshold, at full weight and at one-third.
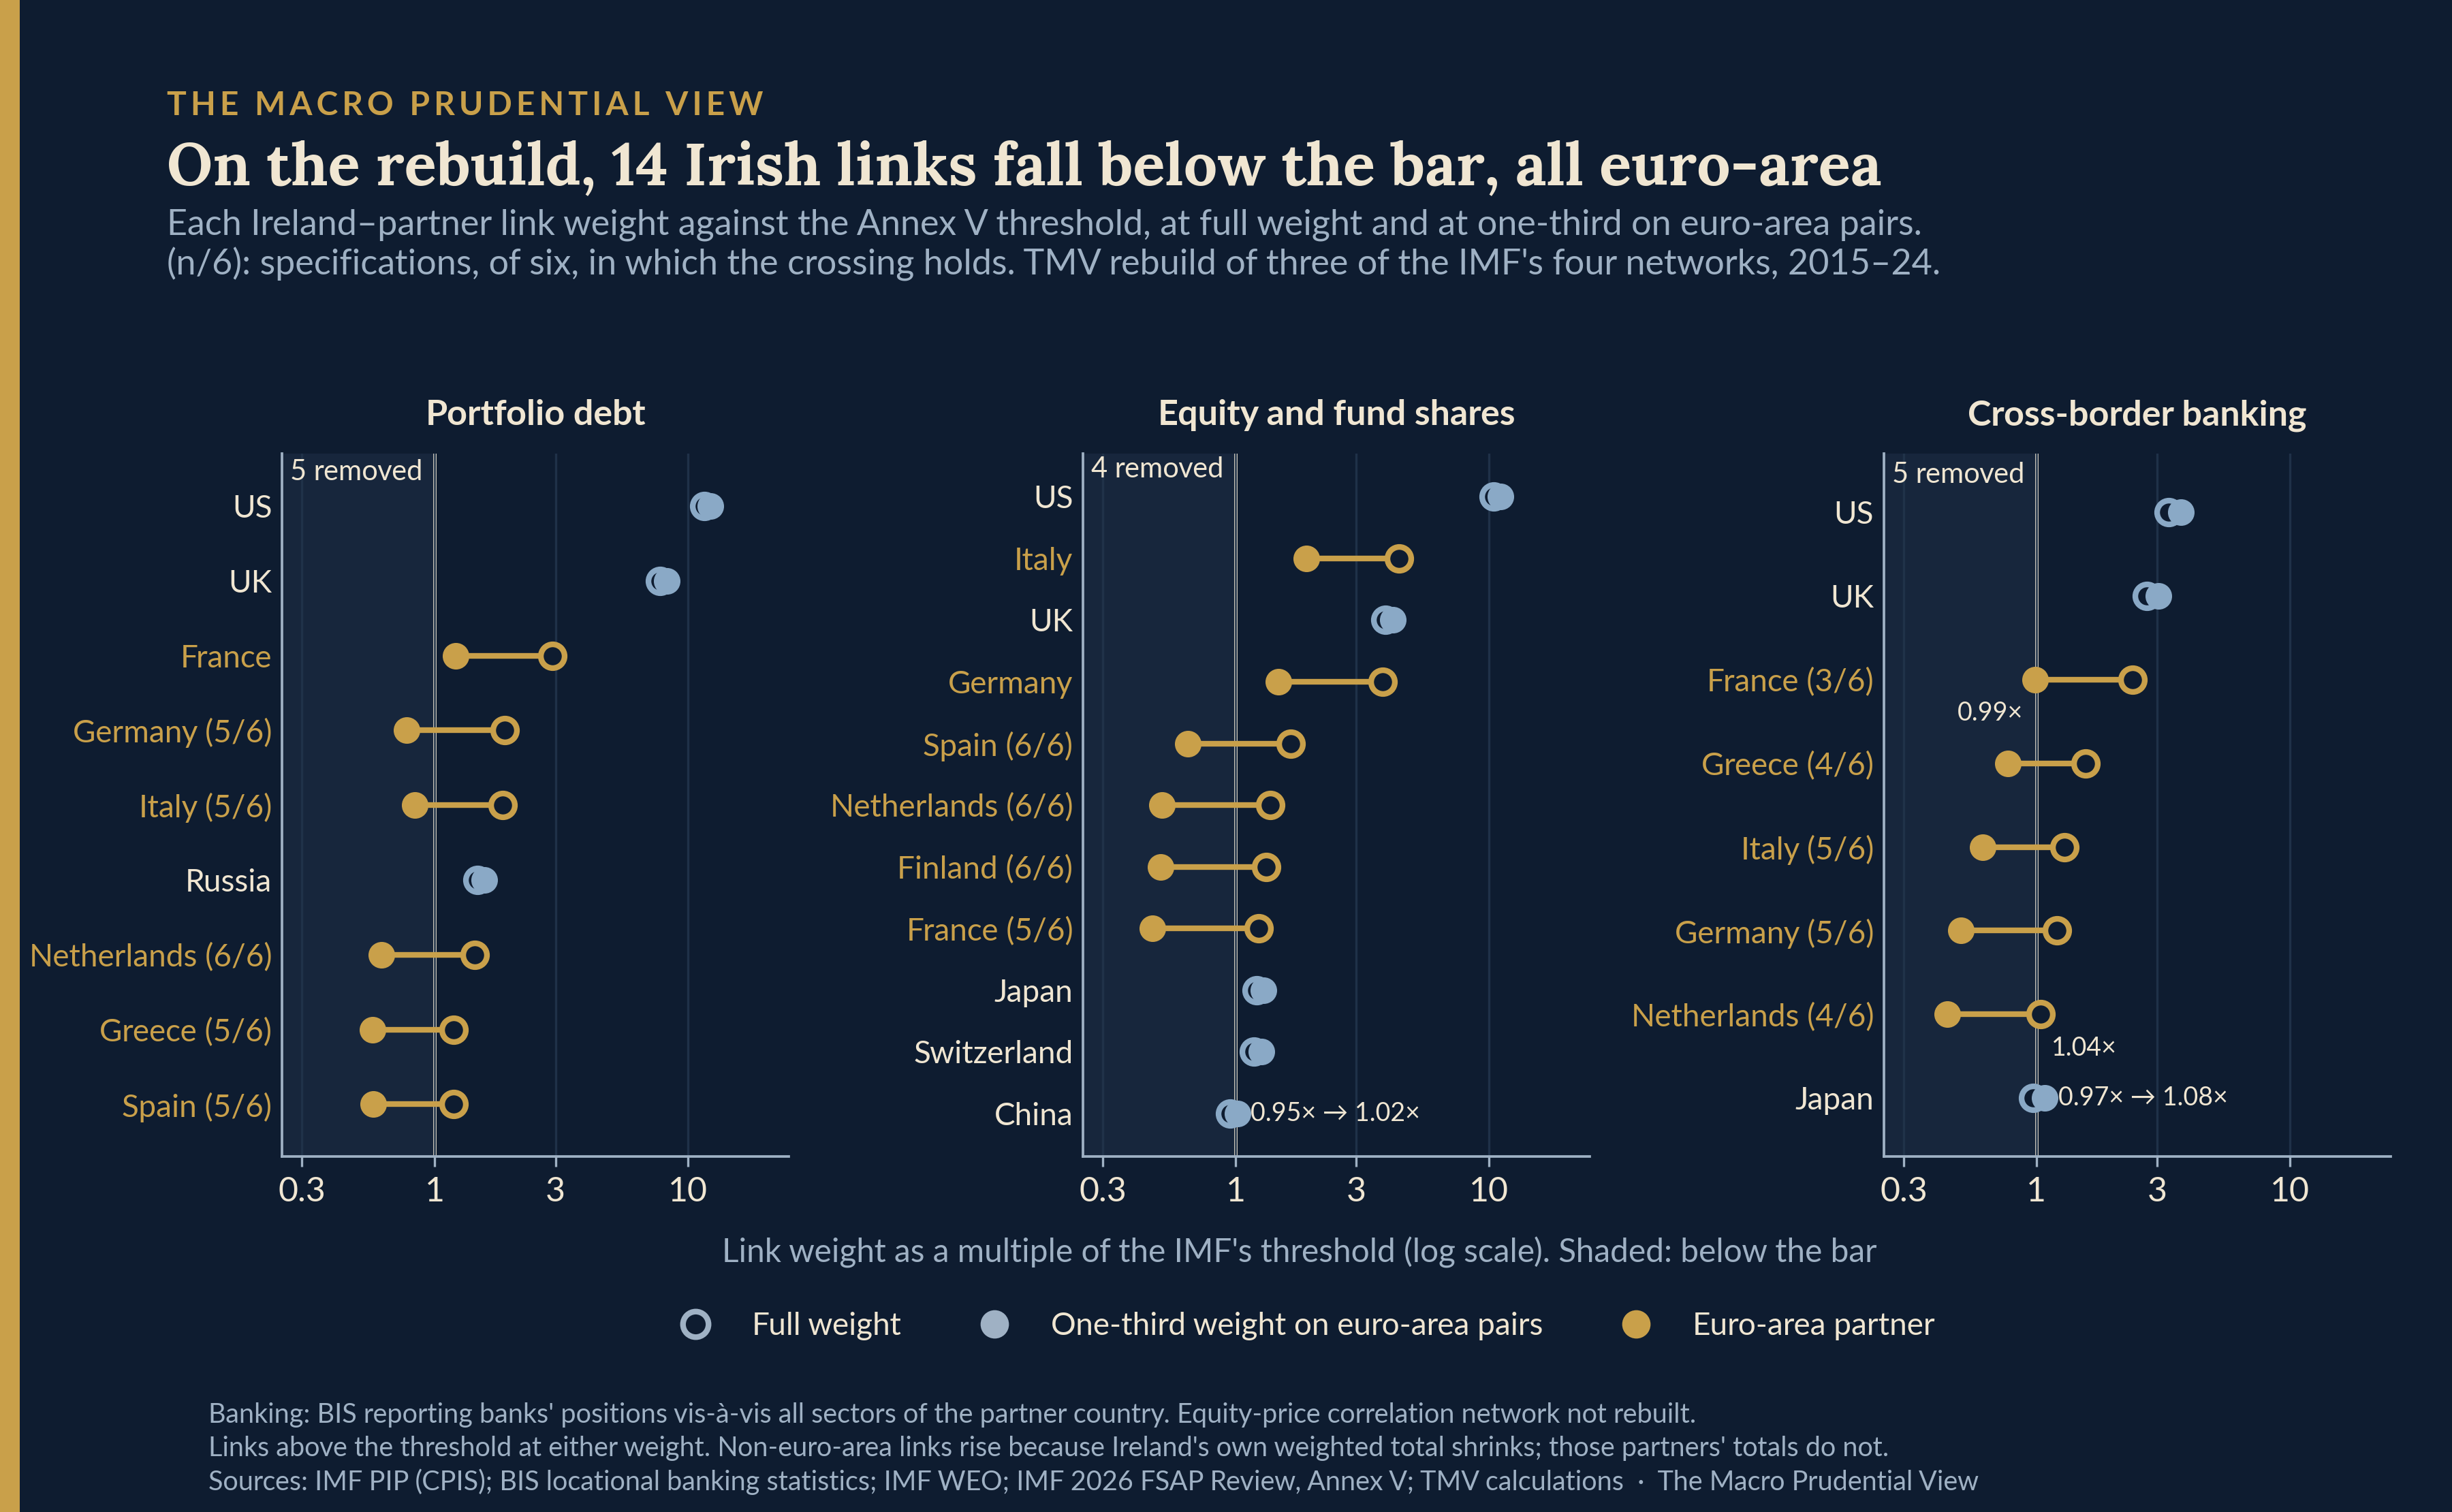
Fourteen links cross from above the bar to below it, all with euro-area partners. Five are in debt, four in equity and five in banking. The links to the UK and the US stay well clear in every network, as do France in debt and Germany and Italy in equity. Discounting shrinks Ireland’s own weighted total, while the totals of its non-euro-area partners are unchanged, so every Irish link outside the euro area rises by the same proportion within a network: 6% in debt, 7% in equity and 12% in banking. That is enough to lift China over the bar in equity and Japan in banking. Neither restores a clique of six: at one-third Ireland’s largest cliques are four in debt, five in equity and four in banking.
A clique can also break on links between two partners. In debt, where Ireland’s full-weight clique is seven, it mostly does not. Ireland has two cliques of seven there, with the US, Germany, France, Italy and the Netherlands in both, plus either the UK or Spain. None of their 21 links sits within 10% of the bar at full weight. At one-third the links between Germany, France, Italy and the Netherlands stay above it. What breaks the cliques is Ireland’s own links to Germany, Italy and the Netherlands, and in the clique that includes Spain, the Ireland–Spain and Spain–Netherlands links.
Many of the fourteen sit close to the line, so I re-ran the ledger under five alternatives: PPP weights, a five-year window, GNI* in place of Irish GDP, and thresholds a quarter lower and a quarter higher. Four crossings hold in every version: the Netherlands in debt, and Spain, Finland and the Netherlands in equity. Seven hold in five of the six, two in four. France in banking holds in only three. The individual partner names are the weakest part of the result. The verdict that Ireland clears six at full weight and not at one-third holds in five of the six versions. It fails only with thresholds a quarter lower, which put Ireland on five years against the paper’s own placement.
Cayman, for contrast
The Cayman Islands show the method’s other constraint. Cayman is among the largest cross-border counterparts in all three rebuilt networks: third in equity at $3.7tn on average over 2015–24, sixth in banking and eighth in debt. It is the United States’ largest single counterpart in portfolio debt and equity. But on the rebuild it has one link above the threshold in debt (the US), three in equity (the US, Japan and Hong Kong) and two in banking (the US and Japan). A clique of six cannot form around a jurisdiction with that few strong links, however large they are. The paper assesses Cayman through the UK authorities, with follow-up in the UK Article IV (para 65).
What the euro-area assessment carries
The paper’s stated reason for the discount is “the presence of supranational authorities and the common regulatory environment, recognizing a still incomplete union” (para 62b), “following a logic similar to the BCBS method” for G-SIB charges. That Basel treatment, agreed by the Basel Committee on 27 May 2022 and set out in the ECB’s statement of June 2022, applies to banks headquartered in the banking union and recognises 66% of the score reduction that would follow from treating intra-banking-union exposures as domestic. For banks the SSM Regulation gives the ECB authorisation and prudential supervisory tasks. For funds the rulebook is common under UCITS and AIFMD, while authorisation, supervision and tools such as leverage limits sit with the home-state authority.
Two paragraphs bear on this, and they do different jobs. Para 63 lists the mitigants for members moving to ten years: Article IV surveillance, “other staff work on systemic risk”, and “the comprehensive euro area FSAP for euro area members”. Para 44 allocates work for every euro-area member’s FSAP, whatever its cycle. In member-state FSAPs, “investment fund stress tests will not be covered since these entities are covered in the systemwide analysis in the euro area FSAP exercise”. Systemwide and NBFI work may instead “be narrowed to sensitivity analyses examining national specificities”. So a five-year French or Dutch FSAP loses the national fund test too, and reversing the discount would not bring back a 2022-style Irish fund test. What the ten-year cycle changes for Ireland is how often the national-specific work recurs. The strongest form of the paper’s position is that union-wide coverage buys more than a national test would, with national specificities handled in sensitivity work and by supervisors on their own cadence.
The published record can test that division of labour on one point: whether the euro-area assessment gives findings for individual fund domiciles, and names who follows them up. The 2025 euro-area FSAP’s technical note on NBFI (IMF Country Report 25/211) ran a liquidity stress test on a sample of over 32,000 funds domiciled in 19 euro-area countries, covering about 70% of sector assets. It modelled redemptions, margin calls and repo collateral calls, and traced spillovers to banks and insurers. The two national tests below did not model margin or repo calls. Irish and Luxembourg funds are presumably in the sample, given their share of euro-area fund assets, but the note does not say so. Its results are published as euro-area aggregates, and neither Ireland nor Luxembourg is named. Its fund recommendations are addressed to ESMA, working with the ESRB, the ECB and the other European supervisory authorities. It asks for an EU-wide test that goes “beyond the existing supervisory stress tests by national competent authorities”, which refers to the supervisors’ own exercises, not to national FSAPs. It also notes that “significant data gaps and challenges in data sharing among EA/EU institutions hinder the depth of such analyses”.
The previous national assessments reported at domicile level. The 2022 Irish FSAP tested Irish fixed-income funds and identified high-yield and emerging-market bond funds as the less resilient categories. The 2024 Luxembourg FSAP tested 1,085 of the largest Luxembourg funds and estimated forced sales of up to €150bn in its adverse scenario, split by asset class and by country. The samples differ and are not directly comparable, and the published figures do not show how much of the Irish or Luxembourg fund sector the euro-area sample covers. What the published record does show is a regional test that is broader geographically and in the channels it models, with no domicile-level results or named domicile follow-up, alongside national tests that had both.
What a review would look at
Directors stressed that staff judgement should be “evidence based, evenhanded, and periodically reviewed by the Board”. A number of them called for “greater flexibility to revisit the SIFS classification between FSAP policy reviews, if circumstances warrant”. Members already scheduled to start an assessment within a year of the Review may keep that schedule (para 66). If the classification is revisited for the euro area, the parameter to examine is the one-third weight. Among the five members that moved, on the rebuild it decides Ireland and, less robustly, Austria. For Ireland, the edges to examine are those that break its qualifying cliques, which in debt are its own links to Germany, Italy and the Netherlands. I do not take a view here on which cycle any member should be on.
Methods note. The rebuild follows the method in Annex V of the paper as closely as public data allow. It uses three of the paper’s four networks: portfolio debt and portfolio equity (including fund shares) from the IMF’s Portfolio Investment Positions data, which build on the Coordinated Portfolio Investment Survey, and cross-border banking from the BIS locational banking statistics, taking reporting banks’ positions against all sectors of each counterpart country. The fourth network, built from equity-price correlations, is not rebuilt. Each pair’s exposure is the larger of the two directions, as Annex V specifies, averaged over 2015–24. Exposures are weighted by the two jurisdictions’ shares of world nominal GDP and scaled by each side’s total, as in the paper’s worked example (Annex V, Table 1), and links count when they exceed the high thresholds in Annex V, Table 2. Links between two euro-area members are counted at one-third where stated. The robustness checks vary the GDP basis (nominal or PPP), the averaging window (2015–19, 2020–24, 2015–24), Ireland’s weight (GDP or GNI*) and the thresholds (a quarter lower and a quarter higher). The discount applies to cross-border exposures (para 62b) and so should not change the correlation network. If that network qualified Finland, Portugal or Greece at full weight, it would also do so at one-third, which the paper’s placements rule out. If it qualified Ireland or Austria, the qualification would survive the discount, which Table 4’s “o” flag rules out. Data were extracted on 23 September 2026.
Paweł Fiedor — The Macro Prudential View
The views expressed are the author’s own and do not necessarily reflect those of the Central Bank of Ireland, the European Systemic Risk Board, the Eurosystem, or any other institution with which the author is or has been affiliated.
Sources: IMF, 2026 Financial Sector Assessment Program Review: Strengthening Agility, Focus, and Impact, Policy Paper No. 2026/036 (paras 44, 56, 61–66, Table 4 and Annex V); IMF, Euro Area Policies: Publication of Financial Sector Assessment Program Documentation—Technical Note on Systemic Risk Analysis—NBFI, Country Report No. 25/211; IMF, Ireland: Financial System Stability Assessment, Country Report No. 22/215; IMF, Luxembourg: Financial Sector Assessment Program—Financial System Stability Assessment, Country Report No. 24/157; IMF, Portfolio Investment Positions by Counterpart Economy (data.imf.org); BIS, locational banking statistics (data.bis.org); IMF, World Economic Outlook database, nominal GDP; World Bank, World Development Indicators, GDP for territories outside the WEO; CSO, modified gross national income (GNI*); ECB statement on the treatment of the European banking union in the Basel Committee’s G-SIB methodology (June 2022); Council Regulation (EU) No 1024/2013; Directive 2009/65/EC (UCITS) and Directive 2011/61/EU (AIFMD), consolidated texts. Author calculations.