



In June I suggested calmer clearing-house margin models may have helped markets absorb the 2026 gas shock. The model ICE now uses is not public. Its old one is, and it moved as it did in 2021–22.
In June I argued that the 2026 gas shock was absorbed in a way 2022’s was not, and that among “the strongest candidates” for why was that central counterparties “have been pushed toward less procyclical margin models, so that a price spike is less likely to trigger the kind of self-reinforcing margin call that drove hedgers out of gas in 2022.” I also noted that the benchmarks that broke in 2022 all clear at ICE Clear Europe, “an intriguing pattern that deserves investigation rather than a settled mechanism.” This is the investigation, and it ends short of where I hoped.
The direct answer is not public. ICE moved Dutch TTF futures to a new margin model, ICE Risk Model 2, on 7 November 2025, four months before the shock, and IRM 2 margins are not public: members see their own, and ICE’s supervisors, the Bank of England and, for a Tier 2 CCP, ESMA, can see the rest. What is public is ICE’s old model, which it still calibrates for TTF every day. On that model, the 2026 margin started from the same level as before the 2021–22 crisis, peaked at a quarter of 2022’s in euros, and moved the same way, in discrete steps that came after the price. Whether IRM 2 did better is something the public cannot currently check. (June’s piece dated the doubling of gas prices to February rather than March, and overstated the rebound in open interest; a correction note fixes both.)
What the clearing houses disclose
CCPs publish a standard set of quarterly numbers under the CPMI-IOSCO public quantitative disclosure standards. I collected them for the CCPs that serve EU markets into one table. ICE’s futures and options service, which reports in US dollars, required $160.7bn of initial margin at its 2022 peak (Q3) and $97.9bn at its 2026 peak (Q1), while its largest single-day variation-margin payment was almost the same in the two episodes, $15.8bn and $15.2bn (Figure 1).
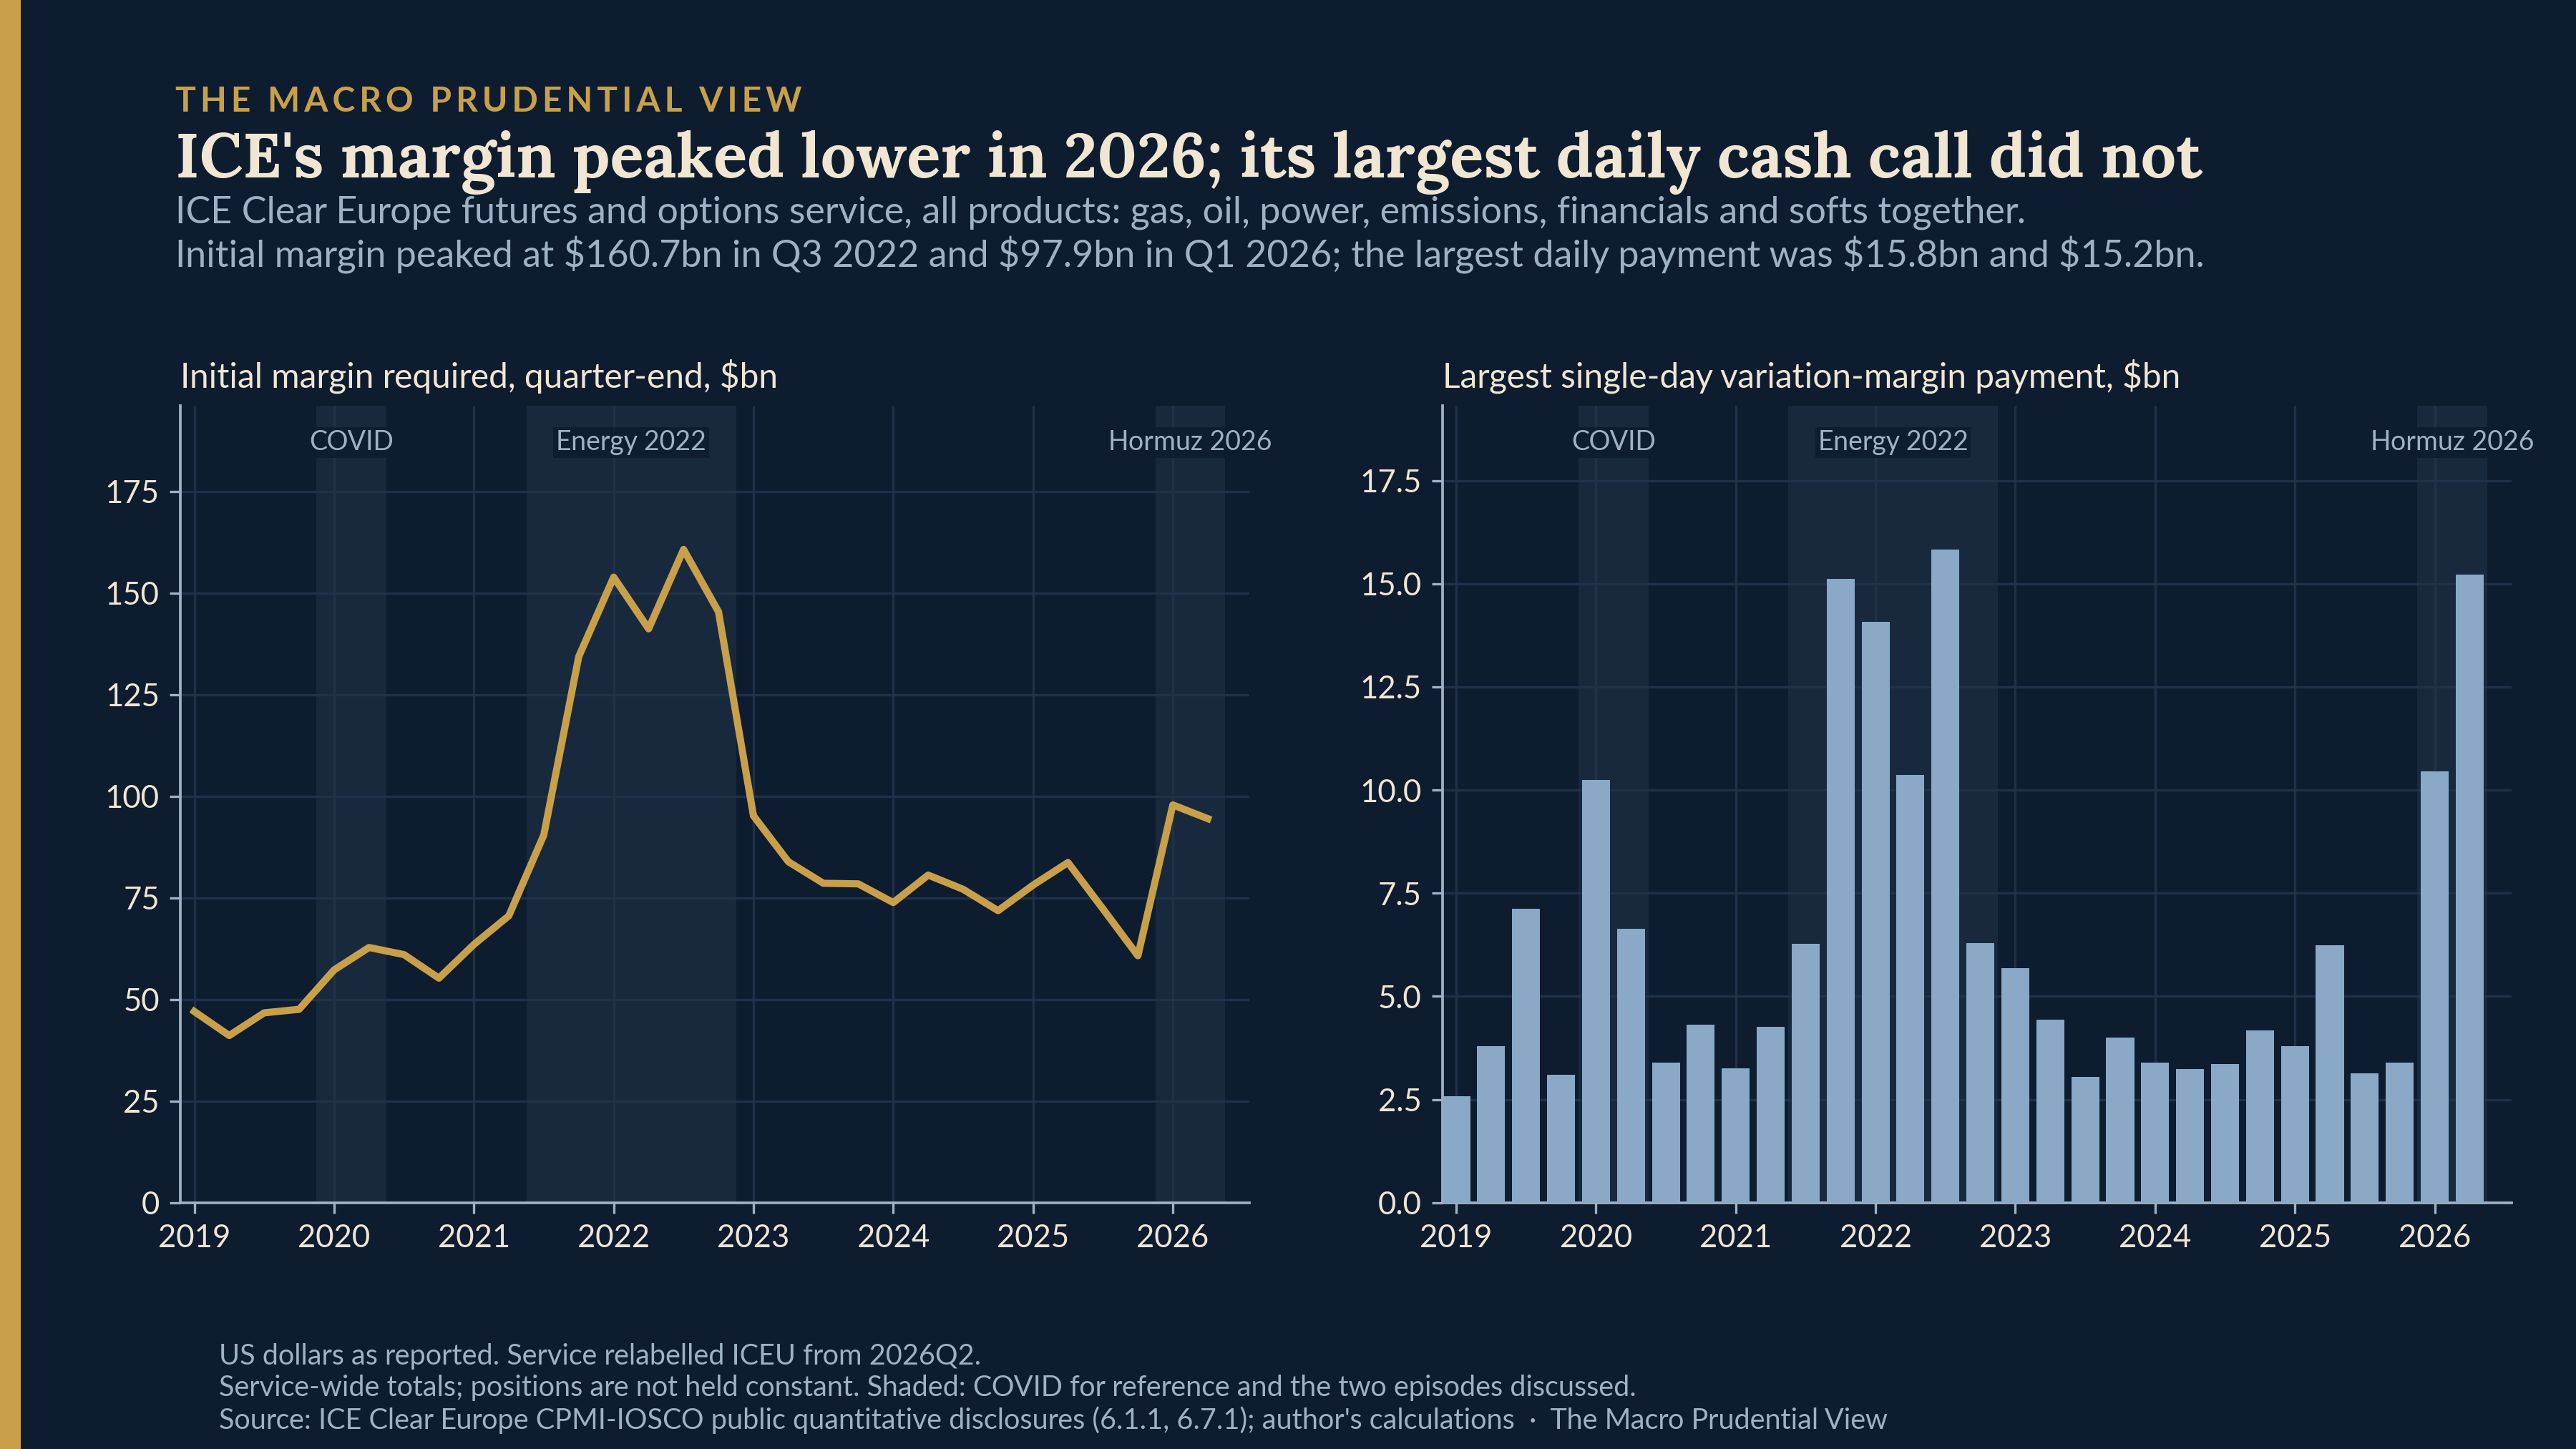
Read quickly, that looks like a margin that bent. The figures cannot carry that reading. They sum every product in the service, so a gas shock and an oil shock land in one number: in the first quarter of 2026 Brent nearly doubled, from $61 to $113 a barrel, alongside the move in TTF, and in the second it swung between $72 and $114 while TTF stayed below its March peak (ICE front-month settlements). Initial margin is a quarter-end stock and nothing holds positions constant. The payment field is variation margin, which follows the price under any model; the margin model June had in mind sets initial margin. The BCBS-CPMI-IOSCO margin work and ECB Occasional Paper 314 make the general point; 2026 is a live case. ECC’s figures have the same limits and are not used below.
The old model, published daily
ICE Clear Europe publishes the parameter files behind its old model, IRM 1, every business day, with history back to at least 2021. For each contract they give a scanning range and sixteen scenarios: fourteen move the futures price by thirds of that range, up to the full range, and two are extreme moves. For a TTF futures position the largest scenario loss is ICE’s scanning range for the contract: the scanning component of the margin, before spot-month and delivery charges and portfolio offsets. Near delivery those excluded charges can be large, and they are not in this series. I use it per megawatt hour, for the front month (the nearest contract month after the observation date). TTF futures moved to IRM 2 on 7 November 2025, and ICE Clear Europe confirmed to me that the Dutch TTF daily options it launched in December remain on IRM 1 (Circulars E25/021 and C25/075). That is why TTF futures, the options’ underlying, reappear in the IRM 1 files from 12 December 2025. So the 2026 series is the old model’s scanning range for TTF, which ICE still sets for the options. As far as the files show, it is the same parameter the old model applied to TTF futures before November: its level carries on without a jump through the migration, sitting in ICE’s simulation files for the five weeks in between, and keeps being recalibrated in the same steps. It is a benchmark for the old model in the 2026 market, and it is not what futures holders paid.
The two models handle procyclicality differently. ICE describes IRM 1 as simulating over a 500-day look-back while putting a 25% weight on stress volatility, “the maximum 250-day volatility calculated on a rolling basis over the entire available history”. IRM 2 simulates over 750 days and instead holds a buffer of at least 25% that is “depleted linearly in periods of increasing stress”. On that description, IRM 2’s window had already rolled past 2022 by March 2026, while IRM 1 carried the 2022 peak in its stress term. A buffer released in stress can smooth a spike, and once used up it can also leave the margin to catch up later; the files cannot say which way it cut in 2026. ICE cites RTS 153/2013 Article 28, as onshored in the UK, for both; ICE Clear Europe is supervised by the Bank of England and recognised by ESMA as a Tier 2 CCP.
In calm conditions the old model’s scanning range was about the same in both episodes, in nominal terms: €4.1–4.5 per MWh in the second quarter of 2021, at prices of €26–32, and €4.1–4.6 in the last quarter of 2025, at €27–32 (Figure 2). In 2026 it first stepped up on 6 February, to €6.39, after TTF had risen by more than a third in January.
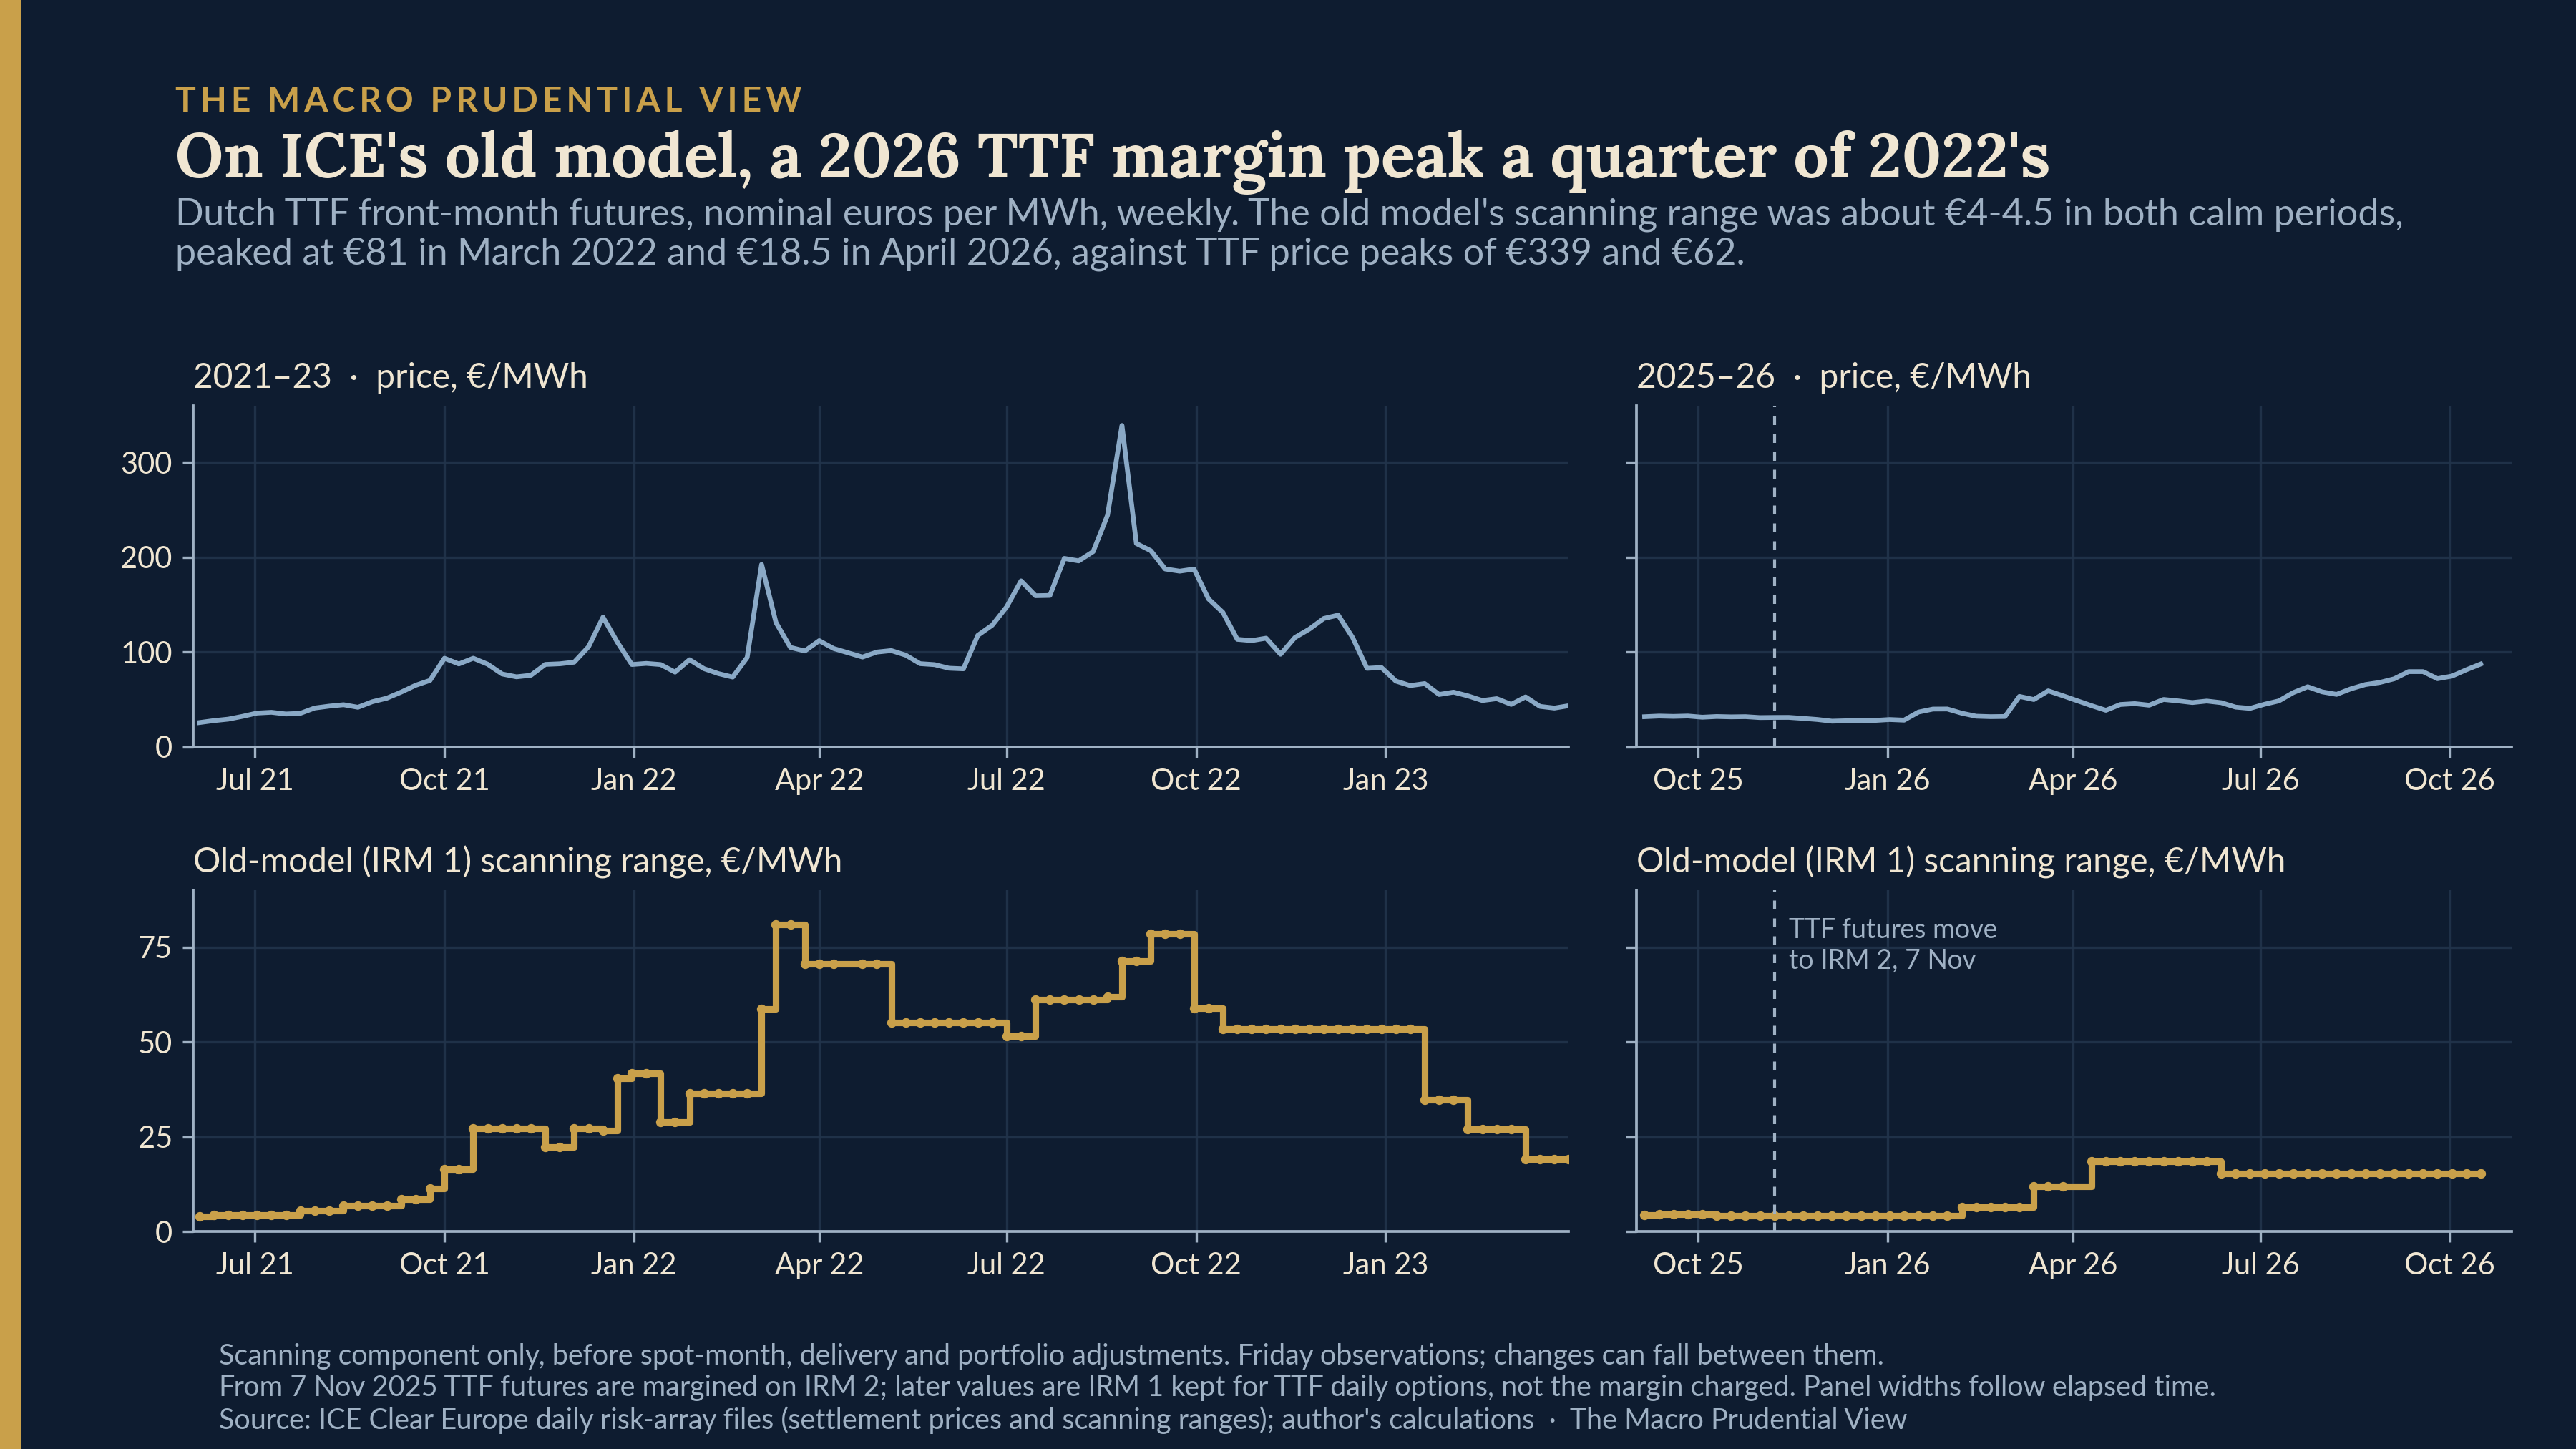
From there the euro amounts diverge because the prices did. In 2021–22 the scanning range reached €41.8 by the end of 2021 and peaked at €81.0 in March 2022; around the August 2022 price peak of €339 it was €71–79. In 2026 it peaked at €18.5 in April, a quarter of the 2022 peak, against a March price peak of €62. In 2021–22 this was the scanning component members faced; in 2026 it is what the old model’s scanning range would have been. On the old model’s own settings, then, margin per megawatt hour rose about €14 from its calm level in 2026 against about €77 in 2021–22, on a price that peaked at about a fifth of 2022’s; a smaller shock is enough to account for that without any new model, though it is not the only thing that differed. I tried to normalise the comparison, by price and by volatility, and neither ratio holds still enough to rank the two episodes: margin as a share of price swung between 19% and 82% in 2022–23, mostly because the price did.
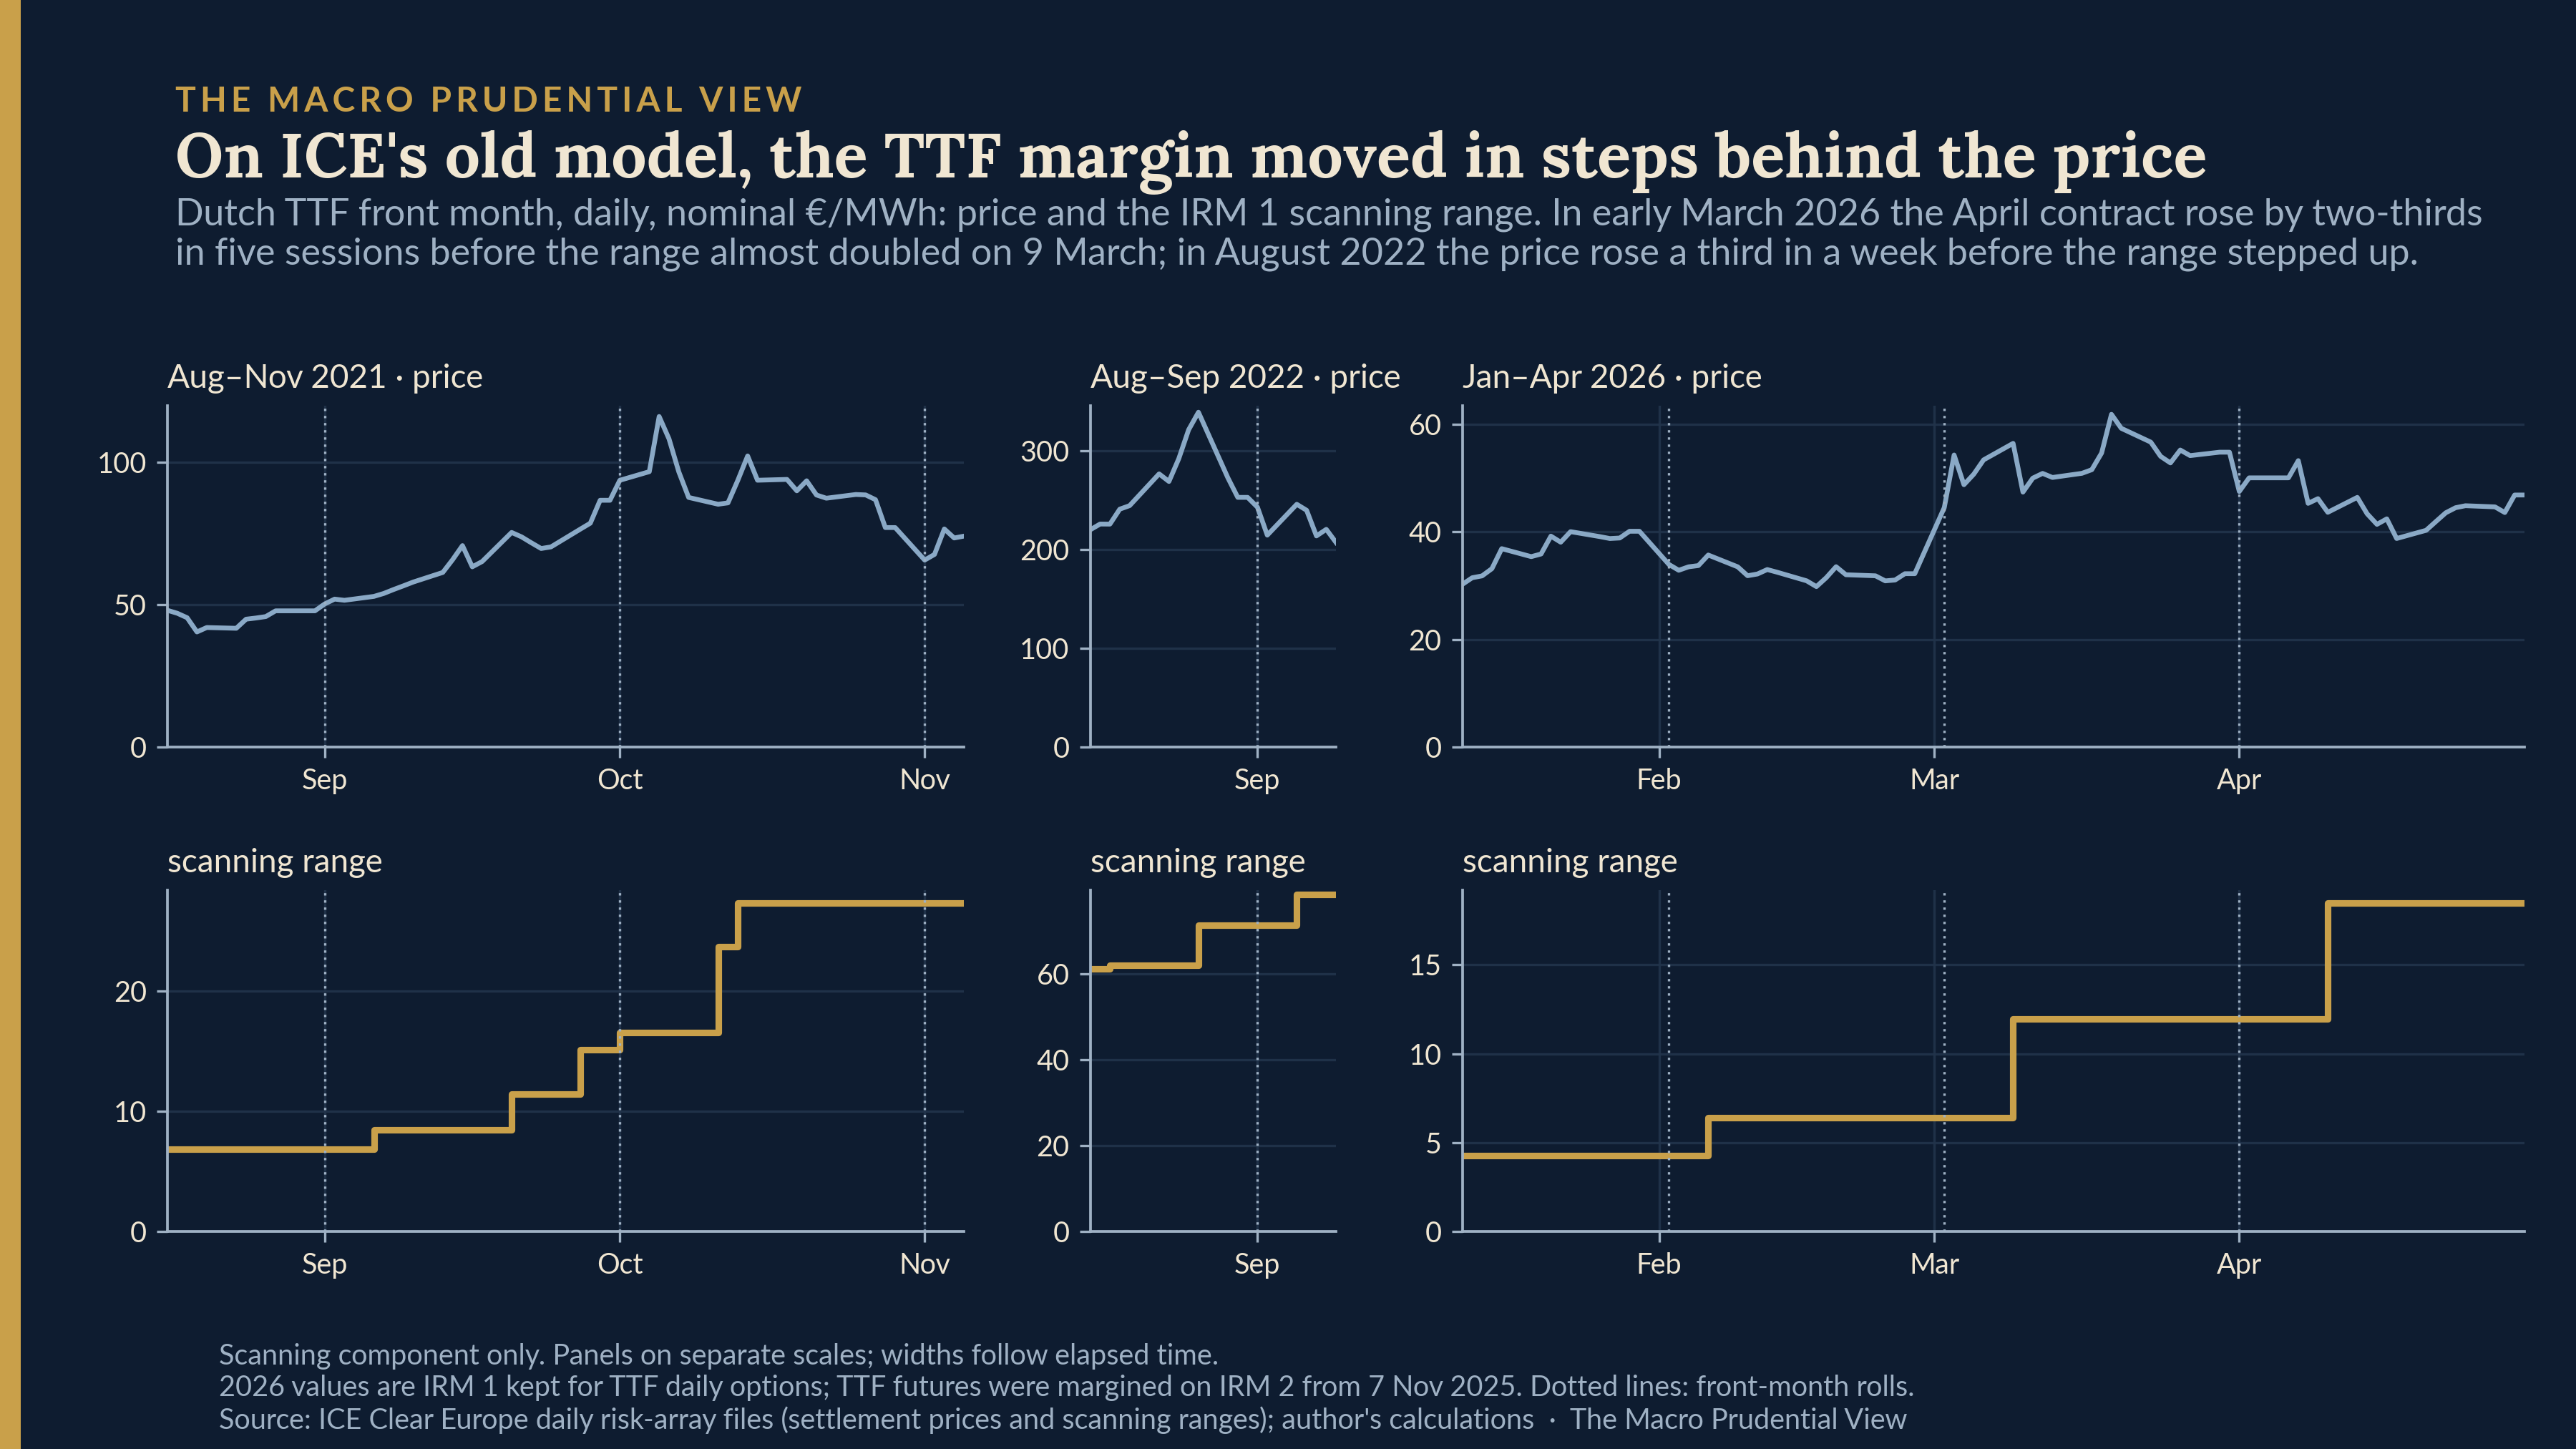
The timing was also familiar (Figure 3). Between 27 February and 6 March 2026 the April contract, front month from 2 March, rose by two-thirds while the old model’s scanning range stayed at €6.39. It almost doubled to €11.97 on 9 March, and stepped again to €18.47 on 10 April, three weeks after the price had peaked and with the price back at €44. These are recalibrations rather than contract rolls: the second month’s range moved on the same days. In autumn 2021 the same pattern ran over a longer rally, with steps every one to two weeks, the last two after the early-October price peak had passed. At the top of the August 2022 spike the price rose by a third in a week, to €321 on 25 August, before the range stepped up the next day.
That leaves the 2022 crisis itself, now part of the old model’s stress history. I rebuilt the scanning range from public prices with ICE’s stated rule. Taking 2022 out lowers the reconstructed March–April 2026 figure by 5–15% and the calm December 2025 figure by 9–21%, depending on how it is removed and how current volatility is measured. Those effects are smaller than the reconstruction’s own errors, which average about 20% against the published series and were larger in March 2026, when the published range lagged. The reconstruction is not precise enough to say how large that effect was, so I draw nothing from it.
What the proposed disclosure could add
The CPMI-IOSCO consultation of 6 May 2026 proposes a new item, 6.9, under which CCPs would publish, for “the most relevant products”, the largest one-day and 20-day increases in initial margin over three-month and one-year windows, with dates and amounts, paired with the change in volatility over the same days. Had it been in force, and had ICE chosen TTF among its products, the 2026 disclosures would have shown the largest IRM 2 margin increases on TTF and when they came, which is the comparison this piece could not make. For ICE Clear Europe the binding route is the Bank of England’s own CCP rules, which are being rewritten, with EU authorities reaching it through ESMA’s Tier 2 recognition; CPMI-IOSCO sets the template both draw on.
To answer June’s question it would need a little more. The draft allows the measure at “single product level or ... synthetic or real portfolios”; a fixed reference position would keep changes in positions out of it. And because a buffer released in stress and a floor raised by an earlier crisis look the same in a margin series, the state of anti-procyclicality tools belongs next to it, over a history long enough to compare one shock with the last.
This piece leaves June’s open-interest evidence where it was, with its limits: it counts positions, not who held them. So does June’s own caveat that the reforms have “not yet been tested by the kind of shock they were designed to withstand”. Nothing here shows whether 2026 strained anyone’s funding, or whether firms were better placed to meet calls than in 2022. What I cannot say is whether the margin model was part of the reason the market held. On the one model the public can see, 2026 looked like the opening months of the 2021–22 crisis, on a smaller shock that kept the old model’s margin far below 2022’s. How the model ICE actually used behaved is, for now, known to its members and supervisors.
Paweł Fiedor - The Macro Prudential View
Positions described are as at 23 October 2026.
The author works at the Central Bank of Ireland and in the ESRB Secretariat. This piece is written in a personal capacity; views are the author’s own and should not be attributed to the Central Bank of Ireland, the ESRB, or the Eurosystem. It draws on publicly available sources and on ICE Clear Europe’s clarification of its published parameter files, and takes no position on whether the policy measures discussed should be adopted.
Sources: ICE Clear Europe, CPMI-IOSCO public quantitative disclosures, futures and options service, 2019–2026Q2 — https://www.ice.com/clear-europe; ECC, CPMI-IOSCO public quantitative disclosures — https://www.ecc.de; CPMI-IOSCO, “Public quantitative disclosure standards for central counterparties”, February 2015 — https://www.bis.org/cpmi/publ/d125.htm; ICE Clear Europe, daily ICE Risk Model array files (energy) and Risk Management page, including the IRM 1 and IRM 2 anti-procyclicality descriptions — https://www.ice.com/clear-europe/risk-management; ICE, “ICE Risk Model 2” — https://www.ice.com/clearing/margin-models/irm-2; ICE Clear Europe Circular C25/069, “ICE Risk Model 2 (IRM 2) Implementation”, and Circular C25/075, December 2025 — https://www.ice.com/publicdocs/clear_europe/circulars/C25069.pdf; ICE Endex Circular E25/021, “Introduction of Dutch TTF Natural Gas Daily Options”, 27 October 2025 — https://www.ice.com/publicdocs/endex/circulars/E25021.pdf; ICE Clear Europe Risk Department, correspondence with the author on the risk-array file structure, 23 October 2026; CPMI-IOSCO, “Consultation on updated guidance and public disclosures to implement initial margin proposals”, 6 May 2026 — https://www.bis.org/cpmi/publ/d232.htm; BCBS-CPMI-IOSCO, “Review of margining practices”, September 2022, and “Transparency and responsiveness of initial margin in centrally cleared markets”, January 2025 — https://www.bis.org/bcbs/publ/d590.htm; Boudiaf, Scheicher and Vacirca, “CCP initial margin models in Europe”, ECB Occasional Paper No 314, April 2023 — https://www.ecb.europa.eu; Commission Delegated Regulation (EU) No 153/2013, Article 28 — https://eur-lex.europa.eu; Bank of England, “Ensuring the resilience of CCPs”, consultation paper, July 2025 — https://www.bankofengland.co.uk; ESMA, list of recognised third-country CCPs — https://www.esma.europa.eu; “The market that learned to bend”, The Macro Prudential View, 15 June 2026; TTF front-month daily prices via investing.com to 11 May 2026, ICE settlements thereafter; Brent front-month settlements from the ICE files. Chart data as cited in each figure.