



In December 2025 the European Central Bank announced that its 2026 thematic stress test would be a reverse stress test, conducted on 110 directly supervised banks and focused on geopolitical risk. Each bank will be asked to identify the scenarios that could produce a depletion of at least 300 basis points in its CET1 capital ratio. The exercise will use existing supervisory data templates, will inform and complement the SREP qualitatively in line with the broader 2026 ICAAP, and is — in the press release’s own language — “not intended to have any implications for Pillar 2 Guidance,” meaning the exercise is structured as a discovery exercise rather than an input to binding capital constraints. Aggregate results are due in summer 2026.
Read narrowly, this is a thematic supervisory exercise on a particular risk driver. Read more broadly, it is the first ECB thematic exercise to use the reverse methodology for directly supervised significant institutions, and the announcement frames it explicitly as a complement to the 2025 EBA exercise — “which assumed a common scenario for all banks and led to differences in their capital depletion.” That sentence in the press release does substantive work: the supervisor is framing the new exercise as addressing something the common-scenario approach does not.
This piece sets out why I think that framing is right. The argument has three parts, none of which is original to me but which fit together more cleanly than they are usually presented. First, the empirical track record of EU-wide adverse scenarios is harder to defend than the institutional discussion typically allows, even using the institutions’ own preferred severity metrics. Second, the methodological objection to single-scenario stress testing is mathematically tighter than the usual “models are imperfect” gloss suggests — and this matters, because the tighter version of the argument has a cleaner constructive response. Third, the methodological direction the ECB announcement points toward is more advanced than the announcement itself implies; the move has been compelling for at least a decade, supported by working papers from inside the major European supervisors, and is now consistent across European regulatory bodies.
The empirical record
Forward stress tests project an adverse scenario over a fixed horizon — typically three years — and ask what depletion of bank capital that scenario would produce. The scenario is published; the depletion is computed and reported; the supervisor and the public assess whether banks would have remained solvent. This is the structure of the EU-wide exercises since 2010 and of the US CCAR exercises over a similar period. The exercise has done useful work: disciplining bank capital planning, producing comparable bank-level data, standardising disclosures, and giving markets a coherent reference point for stress assessment. None of what follows is meant to question those benefits.
Whether the exercise has worked well as a representation of severe outcomes is a separate question. The most direct test is to compare scenario severity against what subsequently happened.
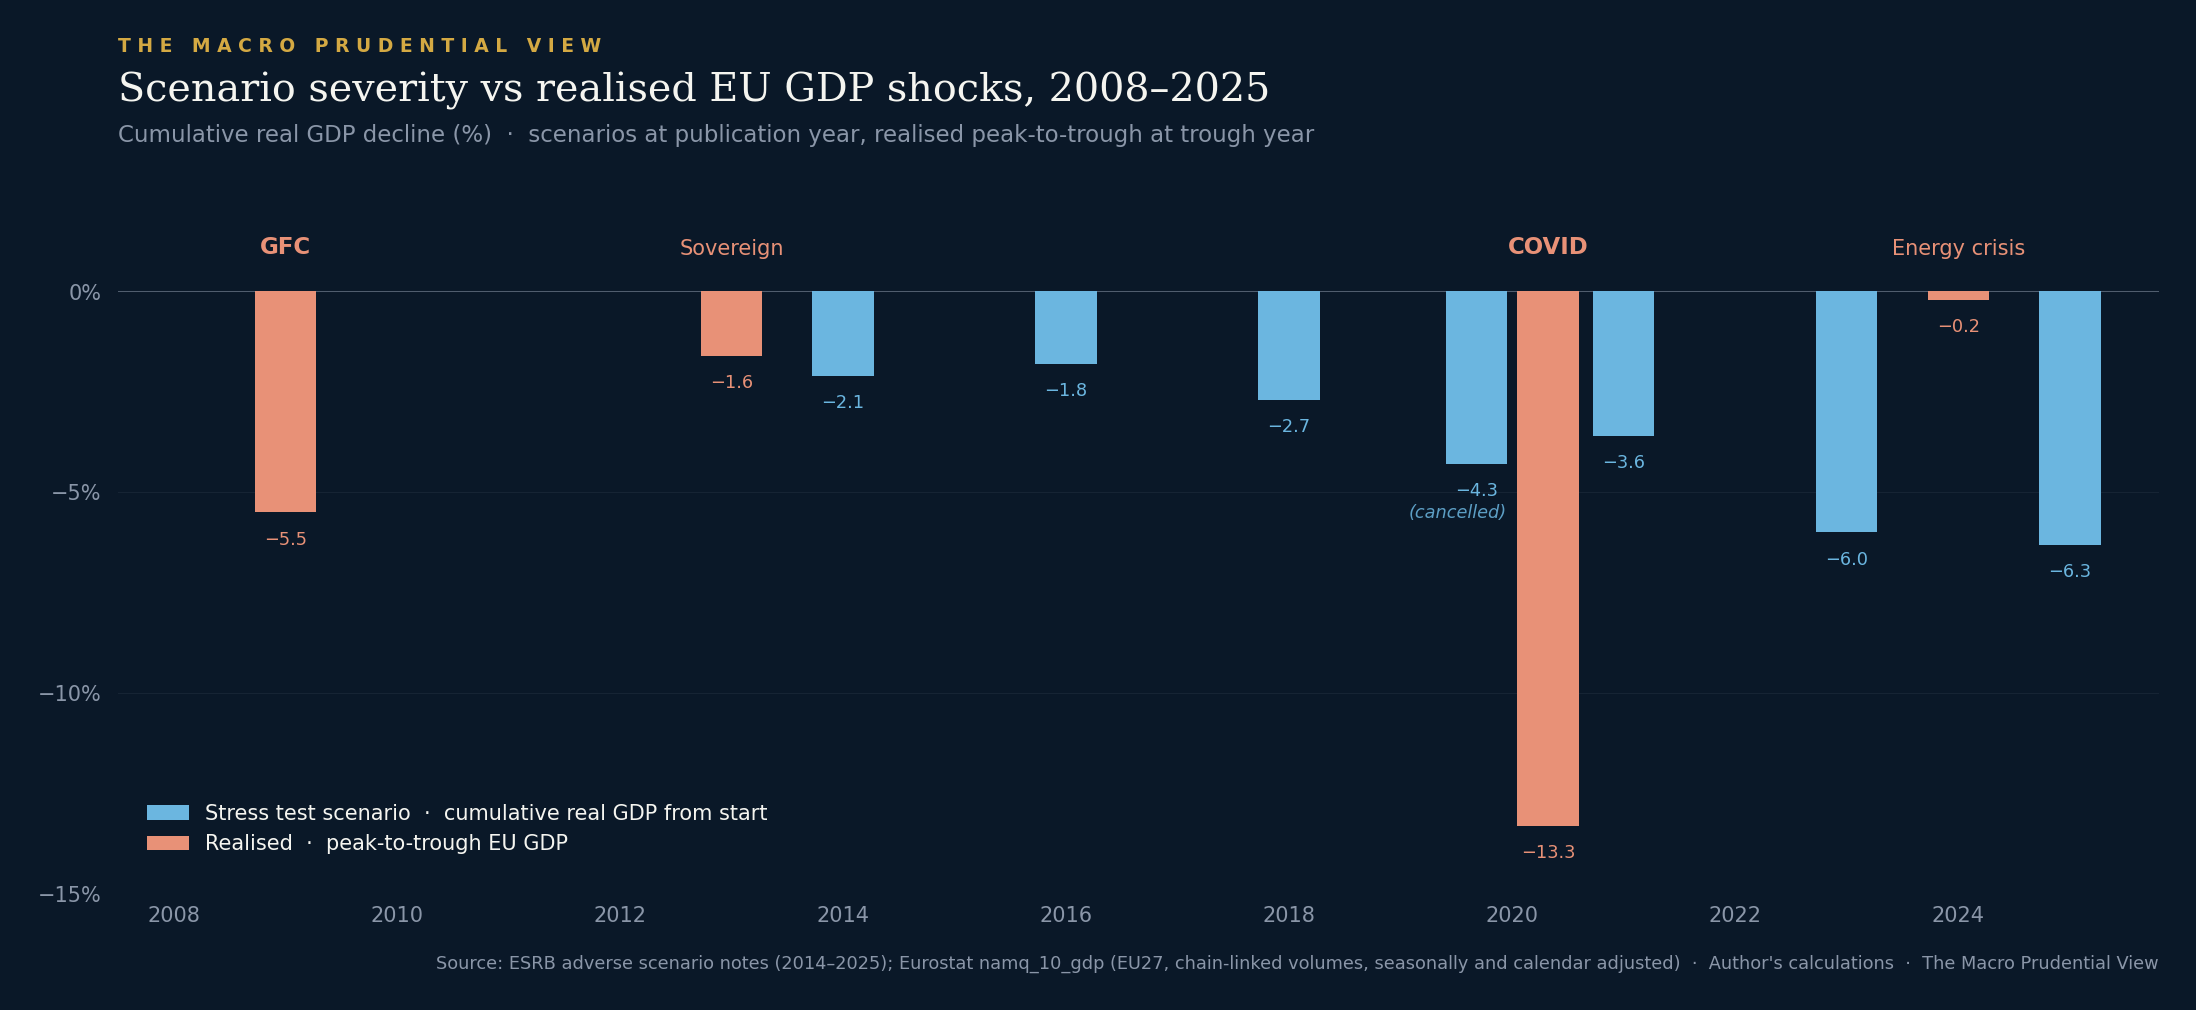
The chart is a heuristic comparison rather than a like-for-like forecast evaluation. Scenario severity and realised severity are measured over different windows — three-year cumulative paths against peak-to-trough declines — and scenarios are designed as plausible severe paths rather than as forecasts. With those qualifications, three observations from the data.
First, no adverse scenario in the series has projected a cumulative decline as severe as the realised peak-to-trough of either the global financial crisis or the COVID episode. The most recent 2025 scenario, calibrated against geopolitical risk and explicitly tightened relative to its 2023 predecessor, projects -6.3% cumulative real GDP — a more contained shock than what the EU economy actually delivered in either of the two major downturns of the last fifteen years.
Second, the 2020 contrast is the most direct. The ESRB scenario for the 2020 exercise was published on schedule in January 2020, projecting -4.3% cumulative real GDP over the 2020-2022 window. The exercise was cancelled in March 2020 as the pandemic arrived — the only time an EU-wide exercise has been cancelled mid-cycle. The realised peak-to-trough EU GDP decline between 2019Q4 and 2020Q2 was 13.3%. The scenario document itself, written weeks before lockdown, contained the line that its severity was “comparable to that observed in the global financial crisis from 2007 onwards.” The realised episode was substantially more severe by every reasonable measure of peak-to-trough decline, even allowing for the different time horizons of scenario and reality.
Third, the energy crisis cuts the other way. The 2023 stress test was calibrated against precisely the kind of geopolitical and energy-price shock that had begun to materialise — and projected -6.0% cumulative GDP. Realised EU GDP through 2022-2024 declined by approximately 0.2% peak-to-trough on the chain-linked volume series. The scenario was, on this metric, an order of magnitude more severe than the realised episode. Both directions of error are present in the same series.
A reader can fairly object that scenarios are not forecasts. The institutions are explicit on this point; the comparison to realised data is not a comparison of like with like. Accepted. But the methodological question remains: do single-point scenarios, however severe, capture the relevant range of outcomes? Realised shocks have repeatedly fallen outside the scenario envelope in both directions — which is exactly what we should expect if single-point scenarios are being used to represent events that have measure zero in a high-dimensional, nonlinear space.
A second observation, this time on the depletion side, sharpens the empirical case.
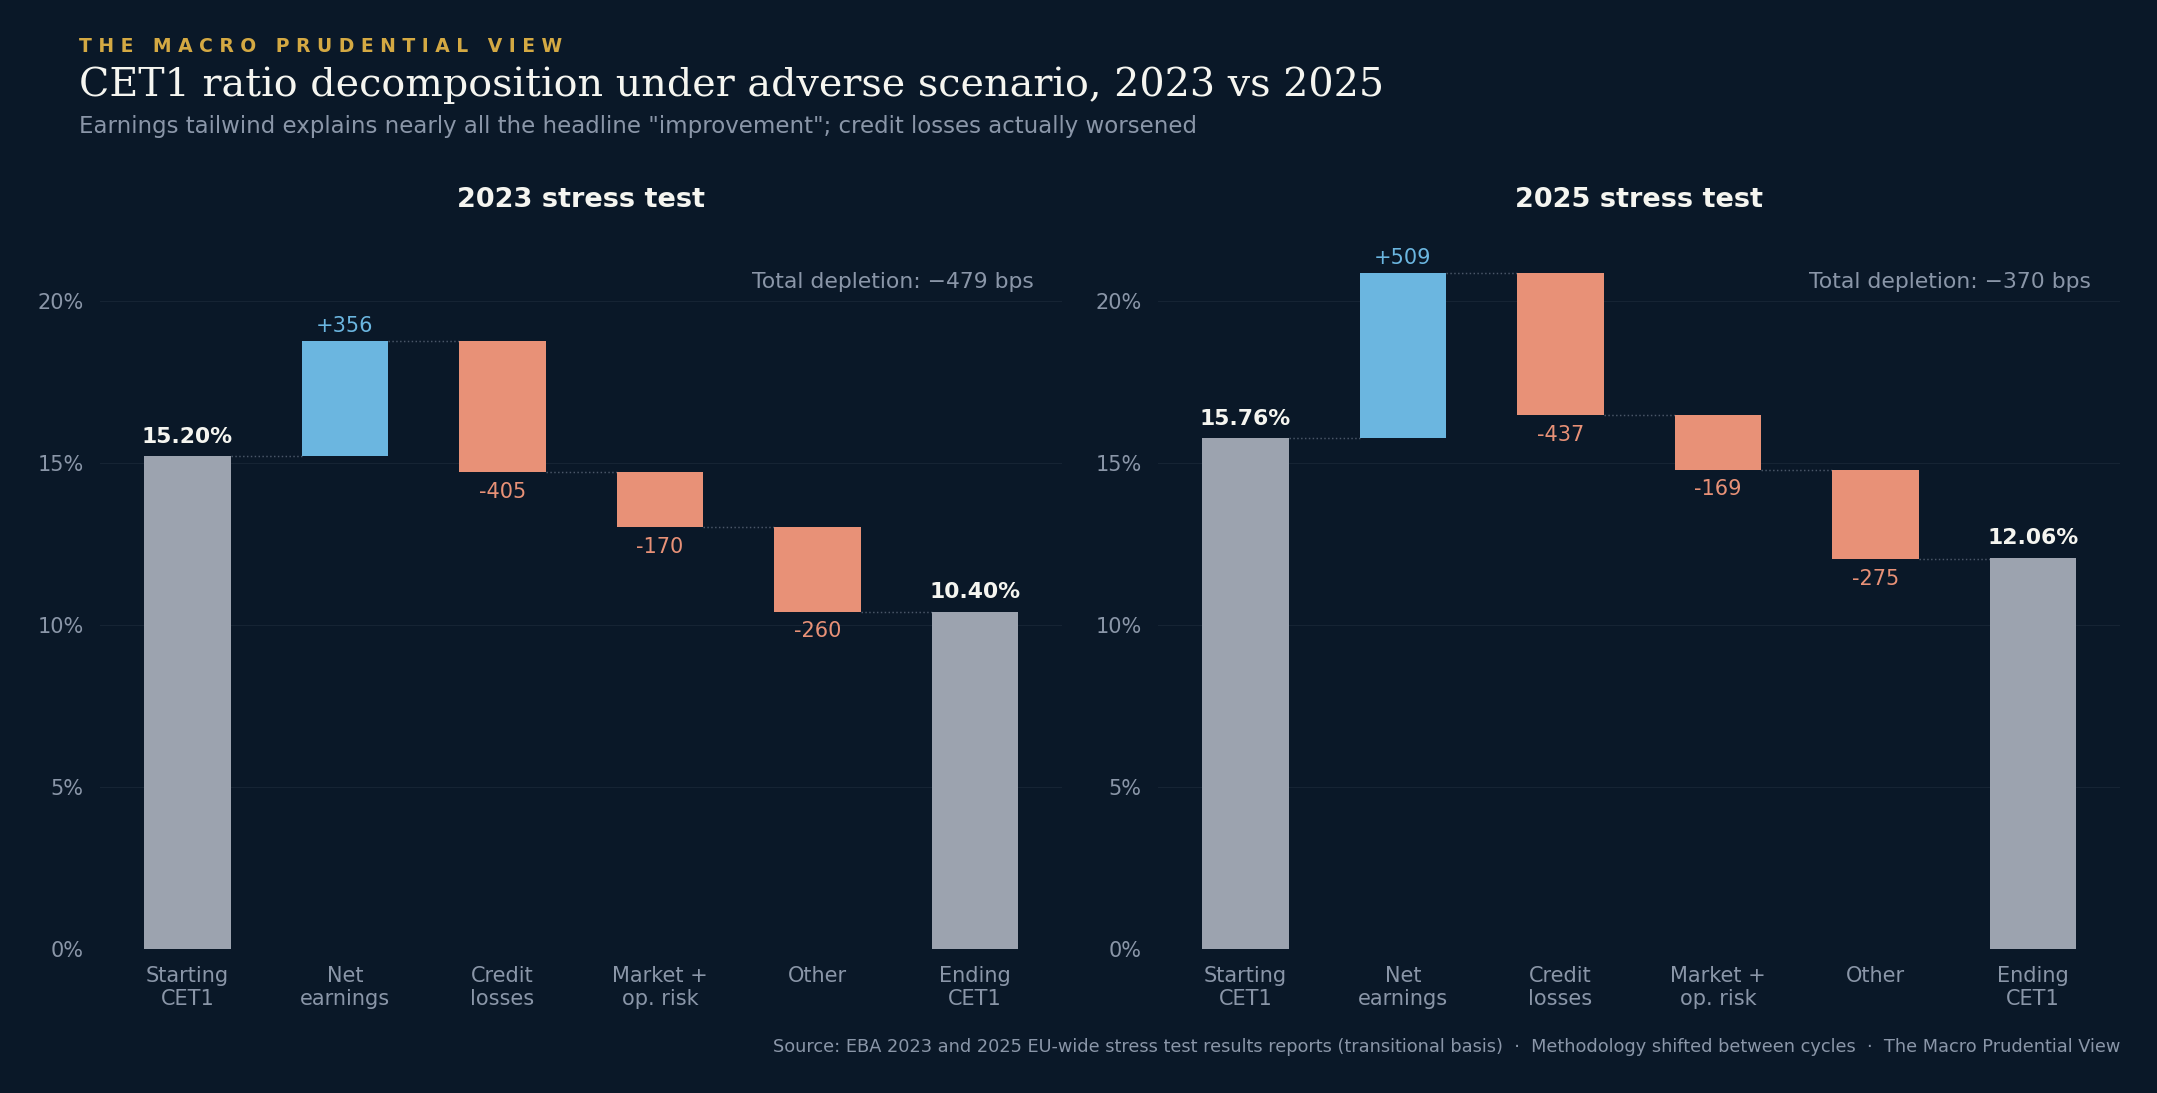
The 2025 EU-wide stress test results were widely reported as showing improved bank resilience, on the basis of a 109 basis point improvement in headline CET1 depletion relative to 2023 (both on a transitional basis). The decomposition tells a different story. Net earnings — predominantly net interest income — contributed +509 basis points to the capital ratio in 2025, up from +356 basis points in 2023. That tailwind is almost exactly what the elevated rate environment between the two cycles would produce. Credit losses, the line item that most directly measures realised risk, worsened by 32 basis points. Market and operational risk projections are not perfectly comparable across the two cycles, less because of a wholesale change in the stress-loss engines than because the 2025 exercise incorporated CRR3-related capital-framework changes, including REA restatements and output-floor effects. Even allowing for that, the headline improvement is overwhelmingly a rate-environment story rather than a risk story.
This is not a criticism of the EBA methodology; it is a feature of how single-scenario exercises decompose. Headline depletion measures the net of all driver lines and is sensitive to the environment as much as to the scenario. The decomposition is itself published, alongside the headline, in EBA results reports. But the headline number is what enters the public discussion, and a reader looking only at “-370bps vs -479bps” would draw conclusions about banking sector resilience that the underlying data do not directly support.
Both charts are facts about how single-scenario stress tests perform. Whether they should perform differently is a methodological question.
The methodological objection
The standard critique of stress tests is that “models are imperfect” or that “tail risks are hard to capture.” Both are true and both are weak. They invite the response that all empirical exercises have these problems and that stress tests are nonetheless useful — a response which is also true. The methodological case has to be tighter than this if it is going to do real argumentative work.
The tighter case has two layers, and they stack.
The first is a point about probability. A stress test scenario is a point in a continuous space — a several-thousand-dimensional vector specifying values for GDP and other macroeconomic variables across countries, sectors, asset classes, maturities, and quarters of the horizon. Any single point in such a space has probability zero under any continuous distribution. The exercise of asking “what is the loss under this scenario” is not the same as asking “what is a plausible severe loss.” It is asking what the loss would be at one arbitrary point. The severity of the point is itself ill-defined except as part of a region of points — which is what reverse stress testing, distributional approaches, and scenario sets are designed to characterise.
The second layer is about the loss function itself. Even granting that a scenario is “approximately right” in some informal sense, the loss function is not smooth in the relevant scenario parameters near regulatory thresholds and behavioural transitions. Outputs are not continuous in inputs near these transitions, and being approximately right on inputs can produce arbitrarily wrong outputs. This is what makes the first objection bite. If the loss function were smooth in scenario parameters, point estimates would be defensible as adequate local approximations. Because the loss function is not smooth, they are not.
The first objection holds in linear-Gaussian worlds. The second is what makes the first matter.
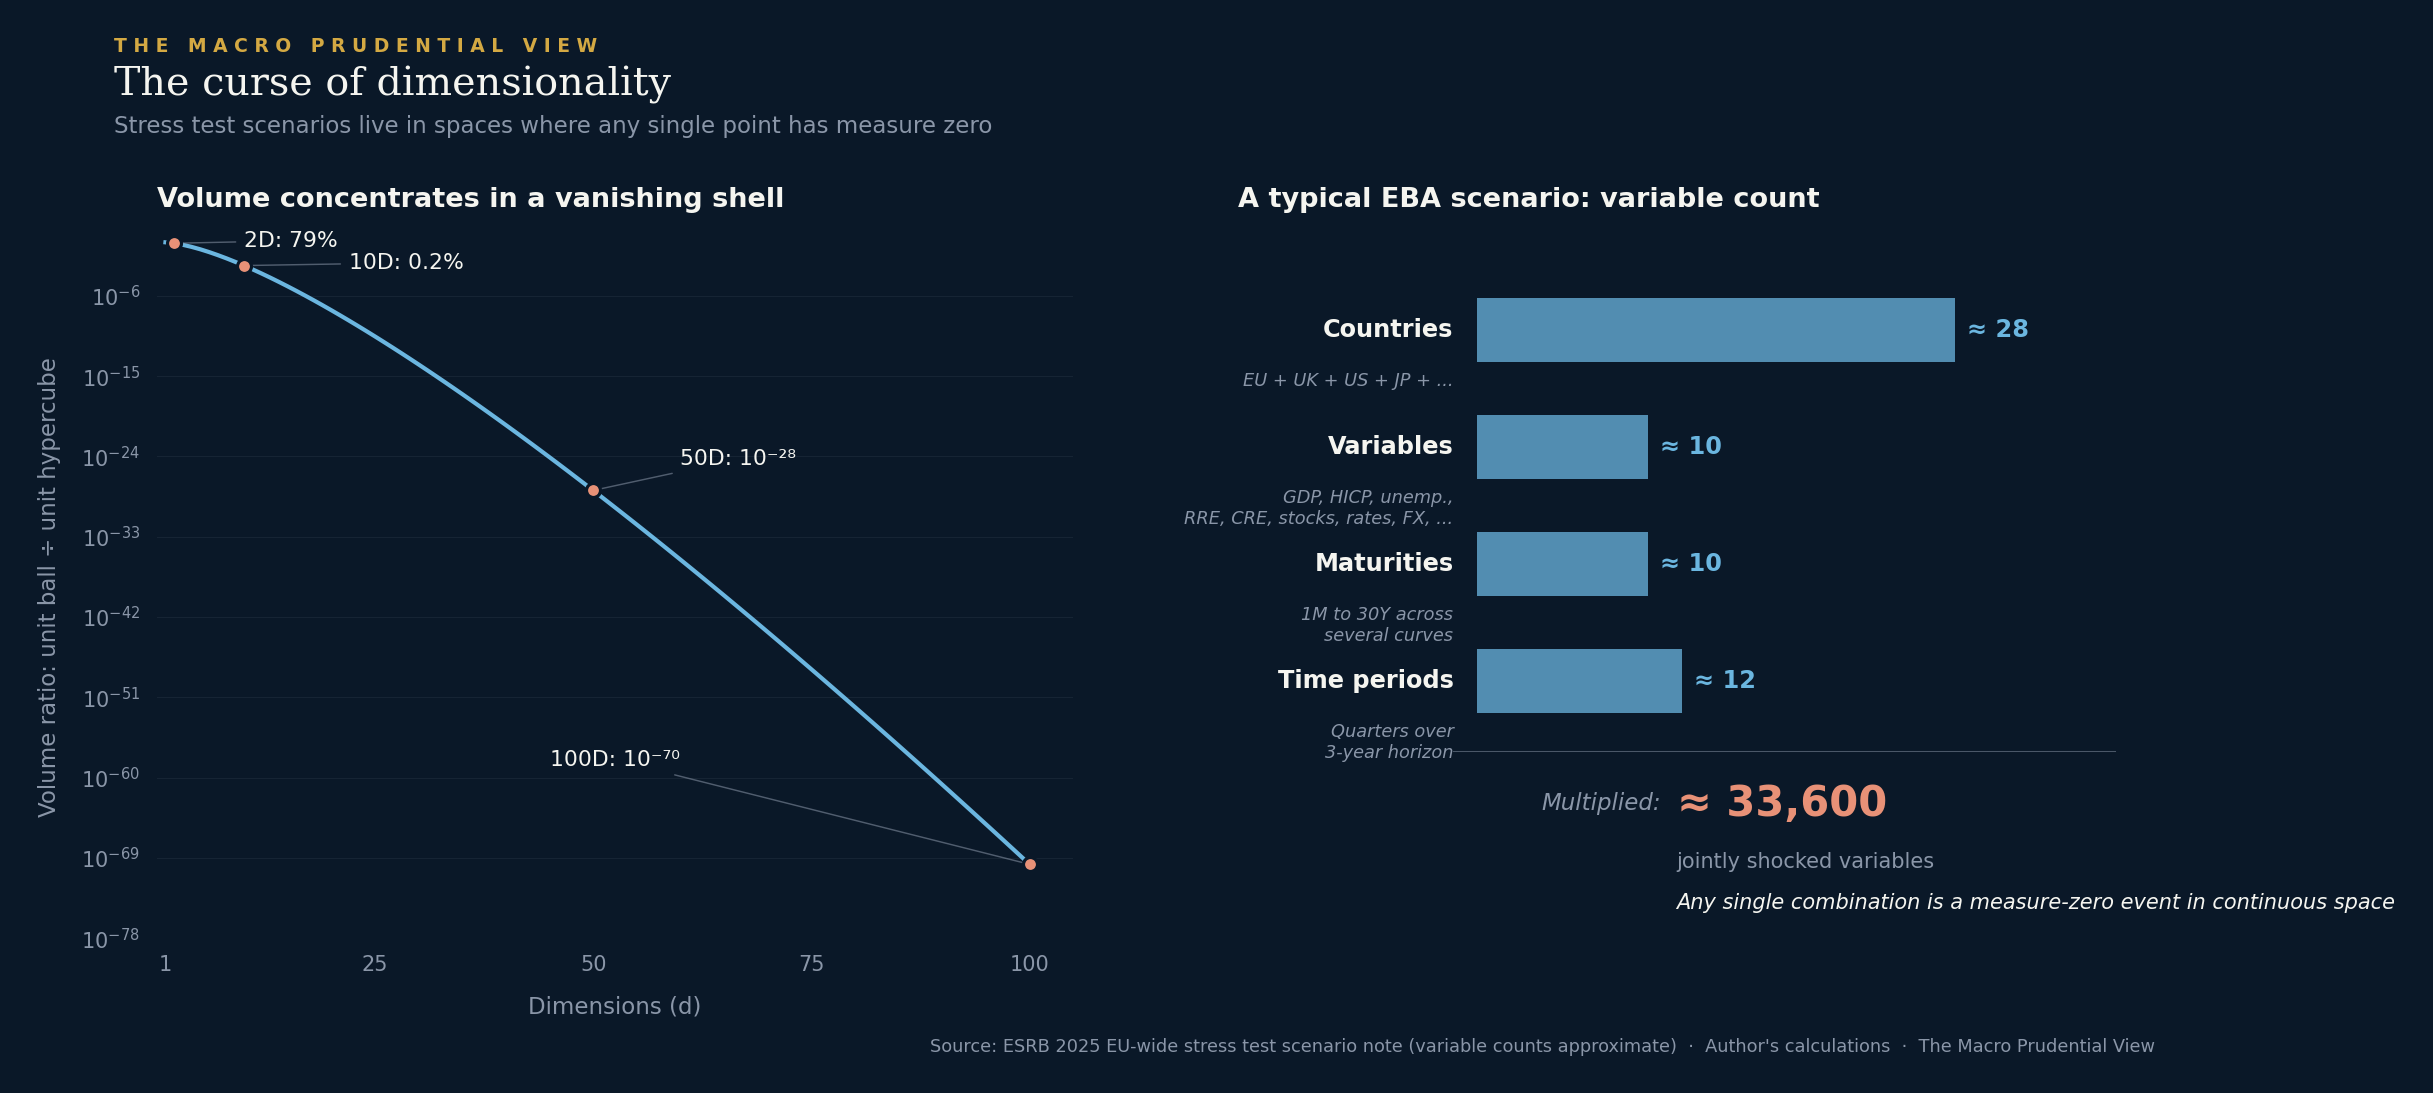
The dimensionality calculation is illustrative rather than literal. The variables in a stress test scenario are not independent and not uniformly distributed, so the volume-ratio formula does not apply directly, and the 33,600-variable count is an approximate multiplication derived from the scenario note rather than an official EBA figure. A quantitative analyst might fairly object that high correlation between variables reduces effective dimensionality to a handful of principal components — global growth, interest rates, inflation, perhaps a credit factor. Granted. But the non-smoothness of the loss function means that even slightly missing the right combination of those core factors can still produce entirely wrong outputs near the relevant cliff edges. Effective dimensionality buys you something for smooth functions and very little for non-smooth ones.
The non-smoothness objection is harder to wave at because it has empirical content. A direct example comes from a recent simulation framework for sterling money market funds.
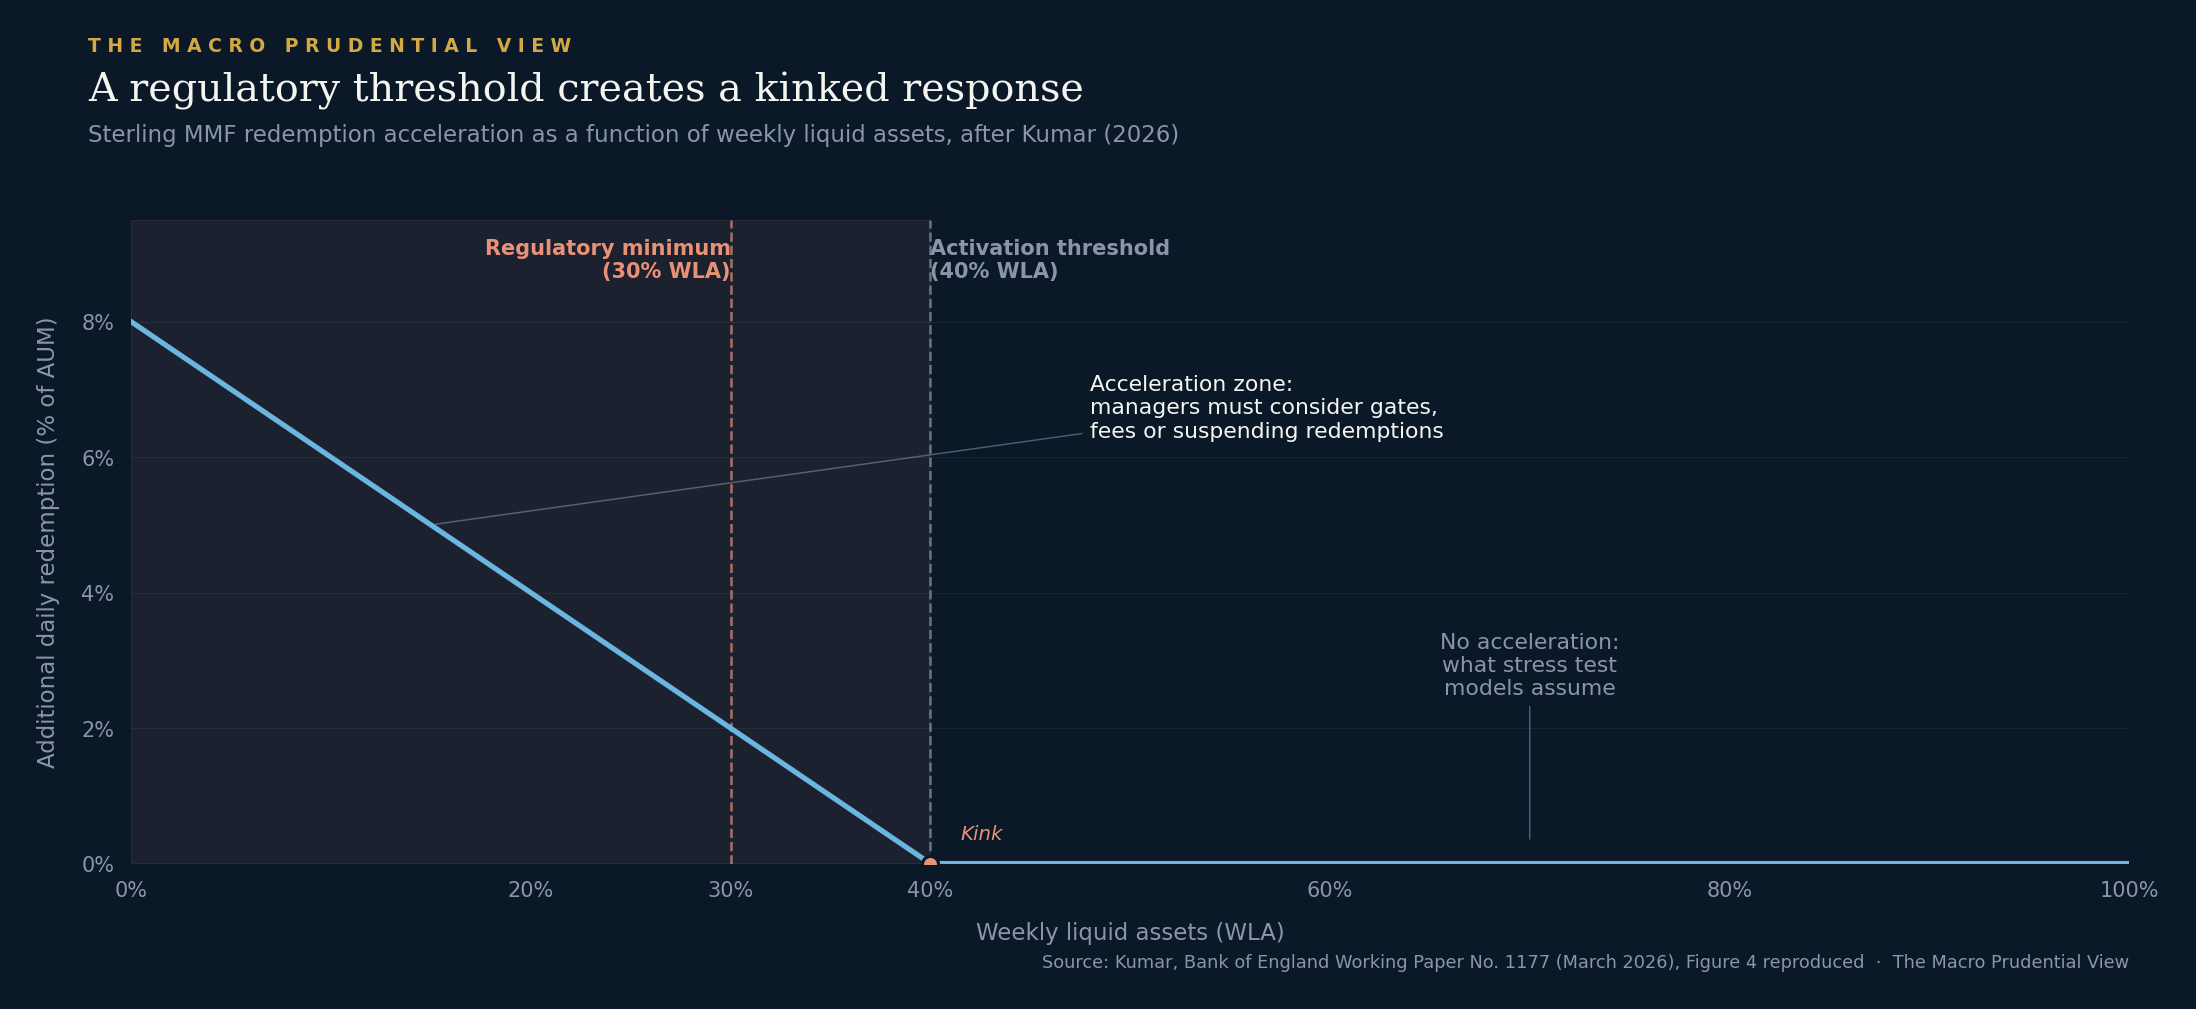
Kumar’s framework approaches the problem from the right end: rather than assuming a particular adverse scenario and computing a fund’s response, it sweeps across the joint space of (redemption profile × market depth × WLA bucket) and computes failure probability as a surface. The headline finding is precisely that the redemption response has a kink at 40% WLA, with the cliff incentive structure activated as WLA falls toward the 30% regulatory minimum. The minimum itself is the supervisory threshold that triggers the acceleration; the 40% activation point is where the acceleration actually begins, ten percentage points before the minimum is hit. A stress test that linearises around current WLA values cannot represent either feature. The supervisor that wishes to know how much capital a fund needs against this risk is not well-served by a single scenario, however severe.
What makes Kumar’s contribution interesting beyond its specific NBFI application is that it is methodologically the same move as reverse stress testing for banks. Specify the failure condition; sweep the parameter space; identify the regions where failure becomes probable. The forward question — “is the fund OK under this scenario” — has been replaced by the reverse question: “what region of plausible futures threatens the fund.”
The constructive response
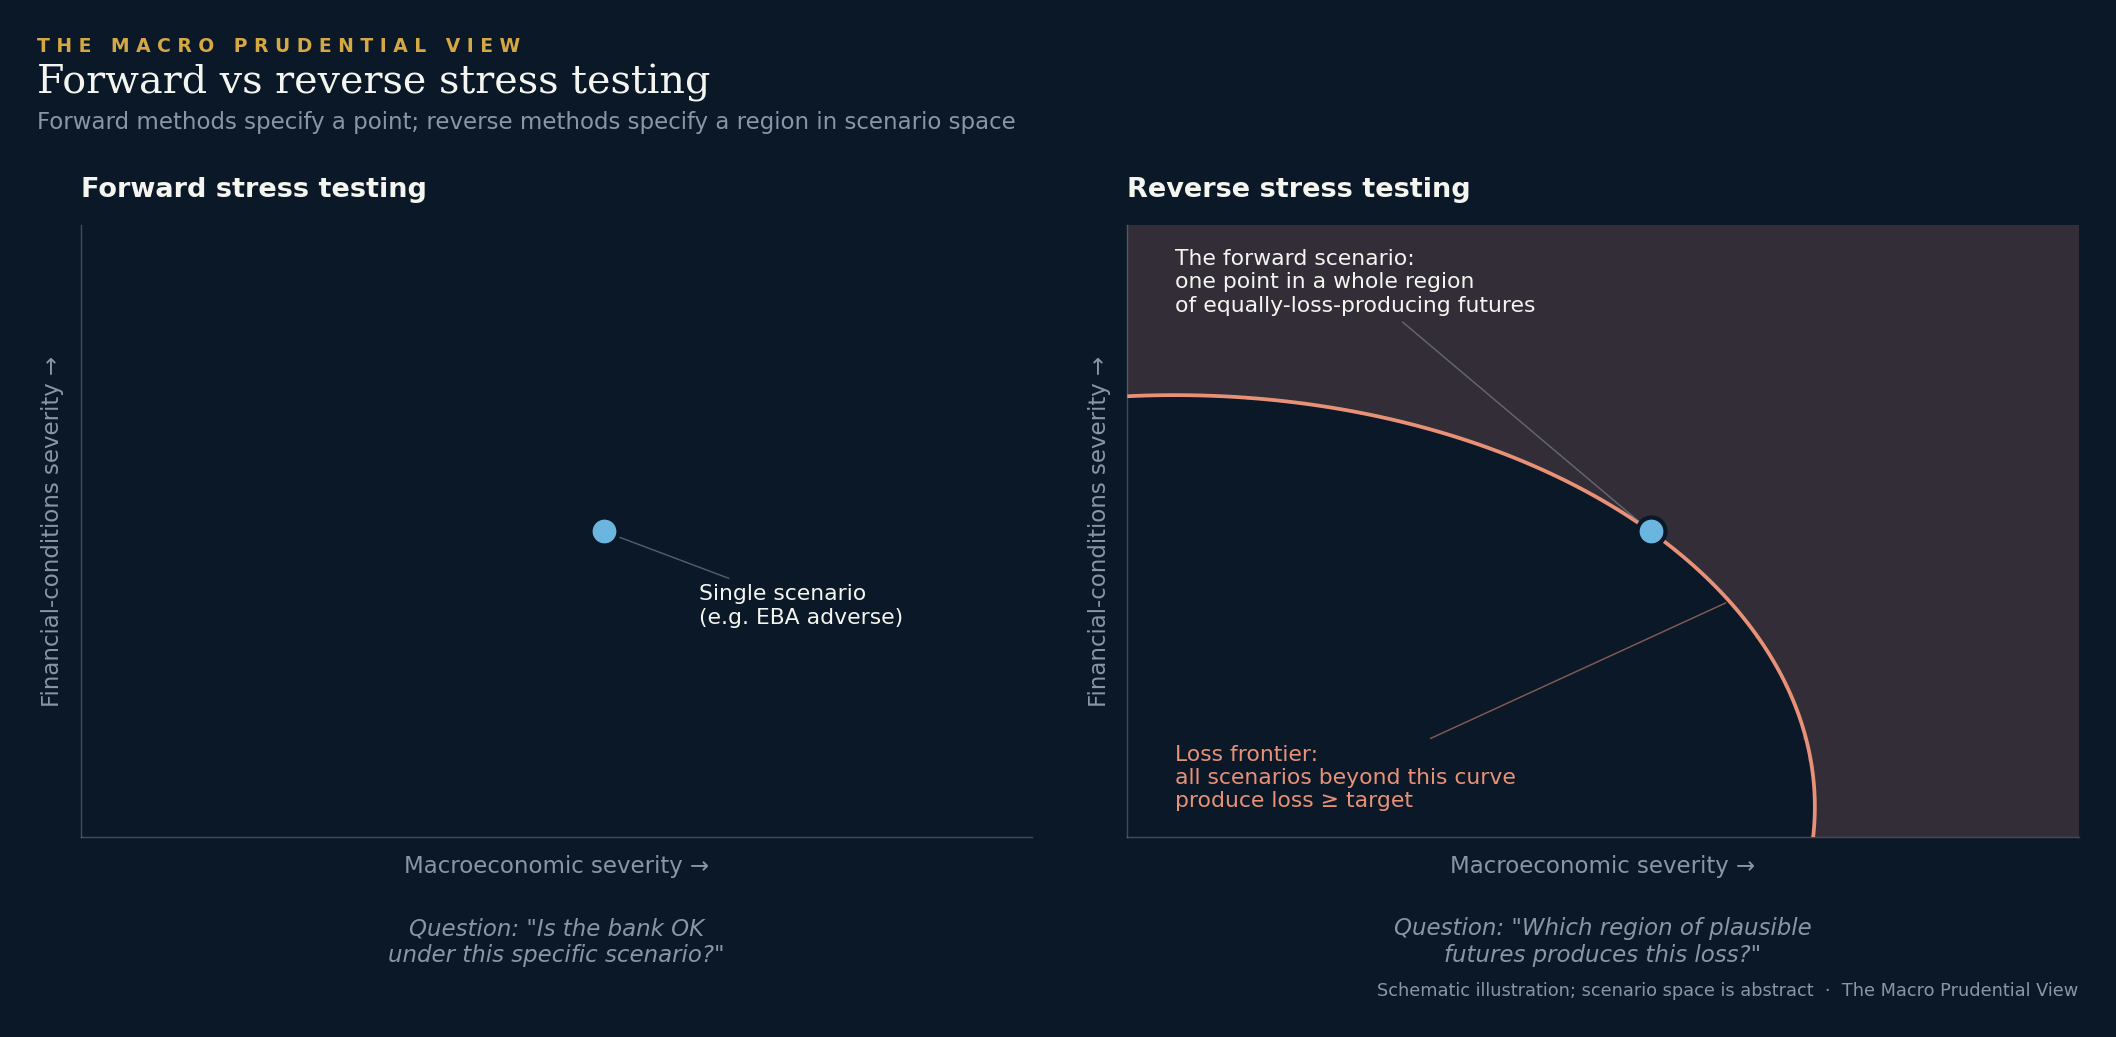
A useful clarification before going further. Three different exercises share the name “stress testing” and are easy to conflate. Supervisory stress testing is the common-scenario exercise applied bank by bank by the supervisor, asking how each institution would fare under a specified adverse scenario; results are used for comparability, oversight, and supervisory review. ICAAP reverse stress testing starts from a pre-defined failure or near-failure outcome and asks which firm-specific scenarios would bring the bank to that point; it is an internal capital-planning tool tied to the institution’s own vulnerabilities and business model, and has been required of banks under European supervisory guidelines for over a decade. Macroprudential distributional stress testing studies the distribution of losses, capital depletion, or credit supply across banks or the financial system; the question is not whether one bank survives one scenario, but how stress propagates across the system and what that implies for buffer-setting and financial stability.
The 2026 ECB exercise is the first thematic supervisory exercise to use the reverse methodology for directly supervised significant institutions — bringing together the structure of supervisory stress testing with a tool that has been in use for ICAAP purposes for some time. Worth noting that reverse stress testing is not the same as worst-case stress testing: it characterises the region of scenarios that produce a target loss, not a single extremal point. The shift is from one point to a set, not from one severe point to a more severe one.
Reverse stress testing has older roots. Banks have been required to conduct internal reverse stress tests as part of capital planning under various European supervisory regimes since 2010. The methodological argument for adopting it as the headline supervisory exercise — rather than as a complementary internal practice — has been articulated for at least as long. Borio, Drehmann and Tsatsaronis put the case cleanly in 2012, in a BIS working paper that has aged well: stress tests in their then-current form were “ill-suited as early warning devices” because the very structure of the exercise — point estimate from a model fitted to non-crisis data — could not capture the nonlinear dynamics that characterise actual financial instability. Their preferred response was not to abandon stress testing but to redesign it: more attention to the structural properties of the loss function, less reliance on the severity of any single calibrated point.
A more recent ECB working paper makes a structurally similar argument from inside the institution. Aikman, Angotti and Budnik (May 2024), in a paper titled “Stress testing with multiple scenarios: a tale on tails and reverse stress scenarios,” frame the case in language that is recognisably consistent with the earlier critique: scenarios “may not always be realistic or severe… can leave aside dangerous possibilities and create an illusion of safety.” The paper’s recommendation — multi-scenario analysis rather than single-point exercises, with reverse scenarios as a complement — sits comfortably alongside the move toward the 2026 exercise as part of the same methodological direction.
I find both of these arguments compelling. The constructive position they share is the right one. Forward and reverse stress testing are not substitutes; they are complements that answer different questions. The forward exercise has done useful work disciplining bank capital planning, producing comparable bank-level data, and giving markets a coherent reference point. The reverse exercise asks a different question — what region of the future threatens us — that the forward exercise structurally cannot answer. A supervisor that runs both is doing more work than one that runs either alone, and the press release’s framing of the 2026 exercise as a complement to the 2025 EBA exercise is exactly the right institutional posture.
There is one aspect of the methodological direction that is worth being honest about. The reverse exercise, like the forward exercise, requires a model. Sweeping the scenario space to characterise the loss frontier is computationally expensive and statistically demanding, and the regions it identifies are themselves model-dependent. The methodological objections that apply to forward stress testing apply, in a different form, to reverse stress testing too. The improvement is real but not unbounded; the loss function we are characterising is still being characterised by a model, and that model is still imperfect.
What reverse stress testing buys is not certainty about the future but a more honest representation of what supervisory analysis can and cannot do. Specifying a loss frontier and asking what plausible futures cross it is dimensionally honest in a way that specifying a point and computing the loss at it is not.
A regime change, slowly then suddenly
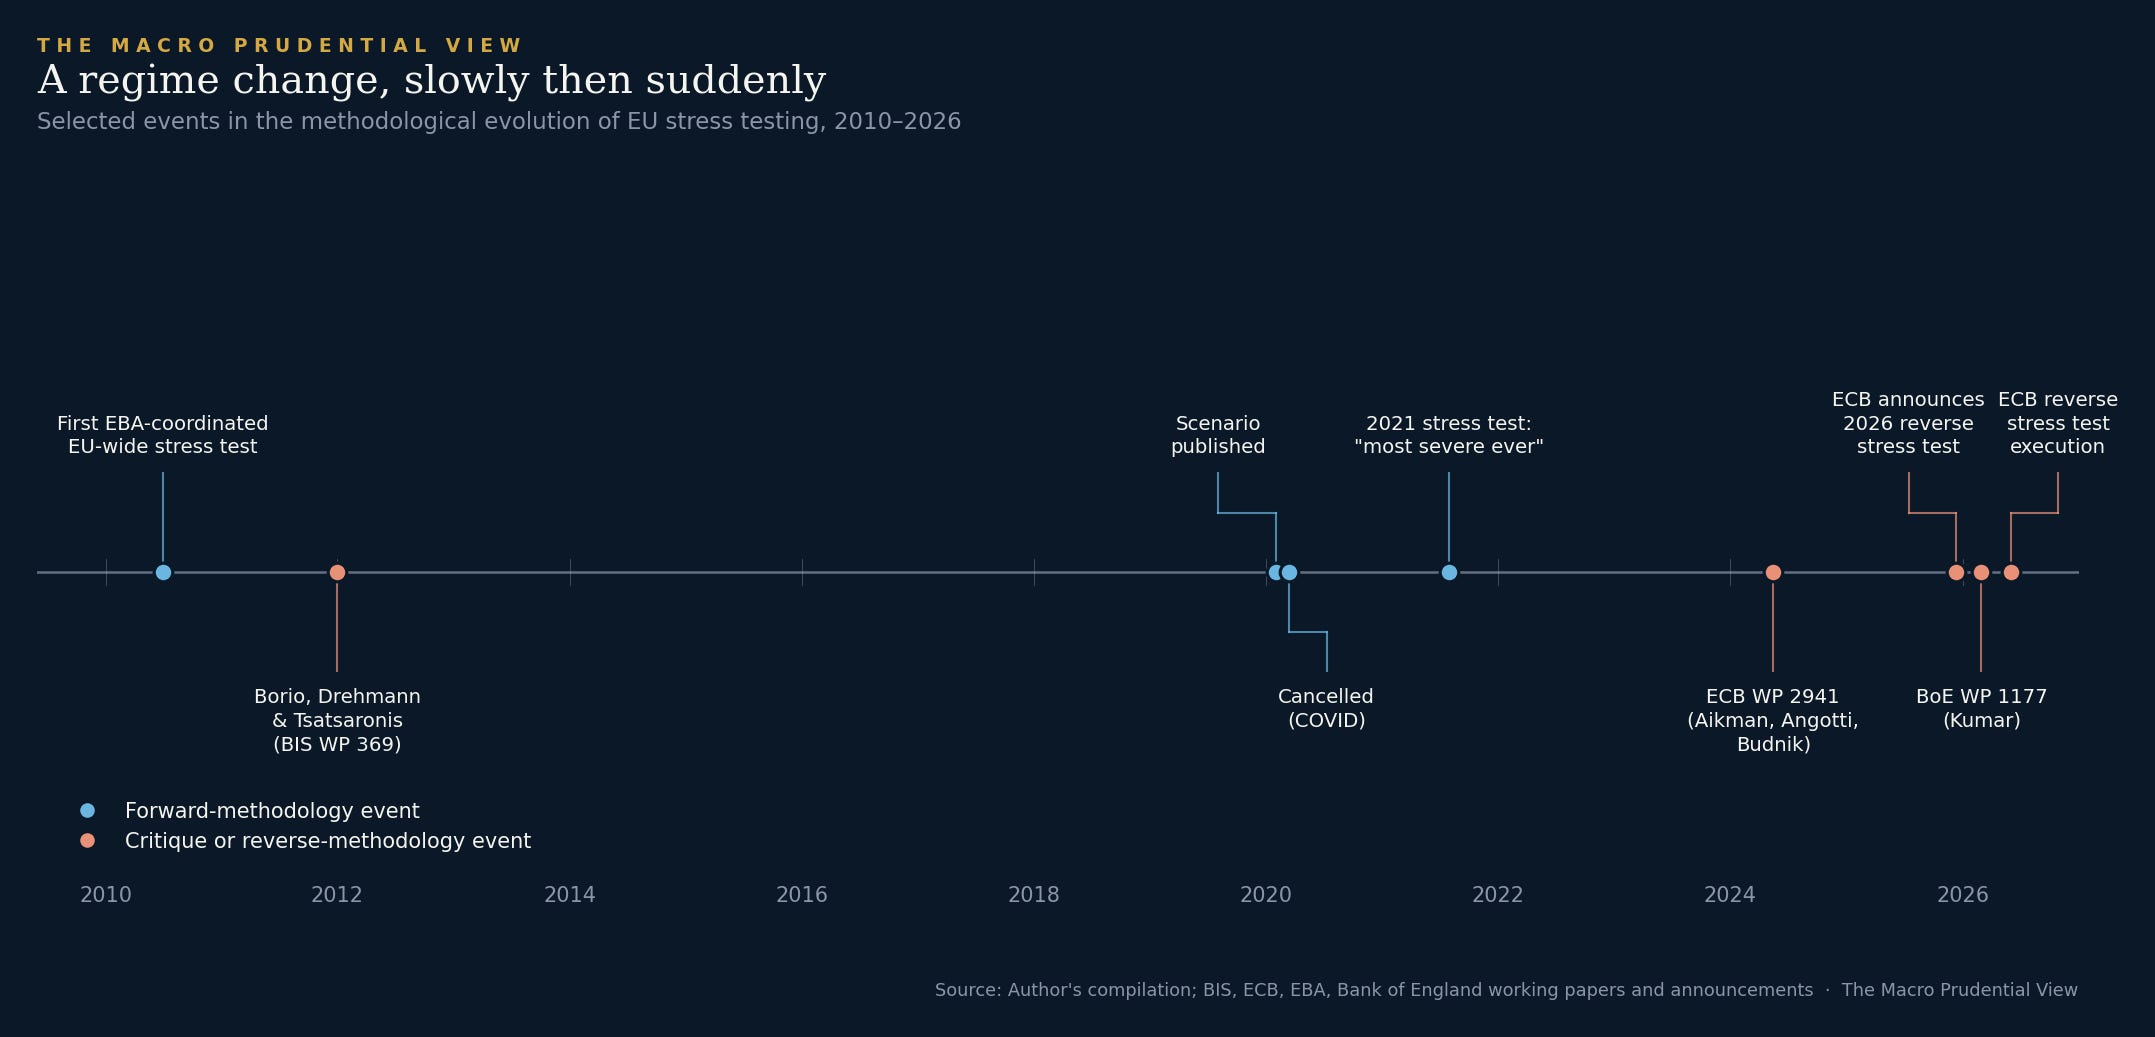
The argument I have set out here is not new. It was articulated in the academic literature by 2012, has been endorsed in working papers from inside the major European supervisors over the past two years, and is now being implemented in the form of a supervisory exercise. The interesting question is not whether the methodological objection is correct — it has been, by now, difficult to dismiss for some time — but why the institutional response has taken the shape it has and on the timeline it has.
My best guess is that two things had to happen at once. First, the empirical track record had to accumulate enough mismatches that the methodological objection could no longer be treated as a theoretical concern. The 2020 cancellation, the 2021 “most severe ever” exercise being followed by a year of NBFI stress that the scenario did not capture, and the 2023-2025 sequence of headline-level depletion improvements driven by rate environment rather than risk — these all happened in close succession and made the case empirically rather than methodologically. Second, the technical infrastructure had to mature enough that the alternative was operationally feasible. Reverse stress testing of the kind the ECB has announced, and parameter-space sweeps of the kind Kumar implements, depend on simulation frameworks, bank-level data infrastructure, and computational resources that were not realistically available a decade ago. The operational lift is substantial: the 110 banks in the ECB exercise have to construct loss surfaces rather than evaluate point losses, and that capability is genuinely new at supervisory scale.
Both conditions are now met. The 2026 exercise will not by itself replace the forward stress test apparatus; the press release is explicit that the reverse exercise complements rather than replaces the EBA’s common-scenario exercises. But it represents a meaningful change in the direction of methodological emphasis, and it is consistent with where the field — academic and supervisory — has been moving for some time.
The regime change has been slow. It seems to be becoming sudden.
Paweł Fiedor — The Macro Prudential View
Charts compiled from ESRB scenario notes for the 2014–2025 EU-wide stress test exercises, Eurostat quarterly GDP series namq_10_gdp (EU27, chain-linked volumes, seasonally and calendar adjusted), EBA 2023 EU-wide stress test results and EBA 2025 EU-wide stress test results. Cumulative growth from starting point taken directly from each ESRB scenario note where reported, or computed from annual adverse-scenario growth rates where the cumulative figure was not given in tabular form. Full referenced papers: Borio, Drehmann and Tsatsaronis, Stress-testing macro stress testing: does it live up to expectations? (BIS WP 369, January 2012); Aikman, Angotti and Budnik, Stress testing with multiple scenarios: a tale on tails and reverse stress scenarios (ECB WP 2941, May 2024); Kumar, A simulation framework for sterling money market funds (BoE WP 1177, March 2026). ECB announcement of the 2026 reverse stress test exercise: press release of 12 December 2025.