



In April 2025, US Treasuries did something they were not supposed to do. The administration’s tariff announcements triggered a sharp equity sell-off — the kind of move that, for a generation, had been the cue for Treasury yields to fall as global capital rotated toward the world’s safe asset. Instead, long-dated yields rose. Bonds and stocks sold off together. The convenience yield embedded in Treasuries — the premium markets pay for “moneyness,” for the property of being valued at face value without anyone asking awkward questions — measurably contracted. Whatever was happening, it was not the textbook safe-haven response.
The episode was not a one-off. The correlation between Treasury and equity returns has been drifting positive since the Fed began tightening in March 2022, and has spent meaningful stretches above zero ever since. The asset that anchors the global financial system has become a regime-dependent hedge — sometimes safe, sometimes not, increasingly conditional on whether anyone has tightened recently or sprung a fiscal surprise.
A few weeks short of the first anniversary of that tariff shock, the European Systemic Risk Board hosted a joint workshop of its Advisory Technical Committee and Advisory Scientific Committee on “A European Safe Asset and Financial Stability.” Olli Rehn’s welcome address framed the question against precisely this backdrop: geopolitical fragmentation, the financing needs of European public goods, the international role of the euro. Philip Lane’s keynote walked the technical landscape — three broad routes to expanding euro safe-asset supply, each with different design properties and different political preconditions.
The debate has shifted. The question is no longer whether Europe needs more safe assets. It is which design produces them, at what cost, with what residual safety properties — and whether the entire concept of a “safe asset” still means in 2026 what it meant in 2011, when the original European Safe Bonds (ESBies) proposal was first published.
This piece works through the empirics and the design space. Five charts, four design families, one question that turns out to be more complicated than it sounds: what does it actually mean to be safe?
The shortage
Start with the volumes, because they are stark.
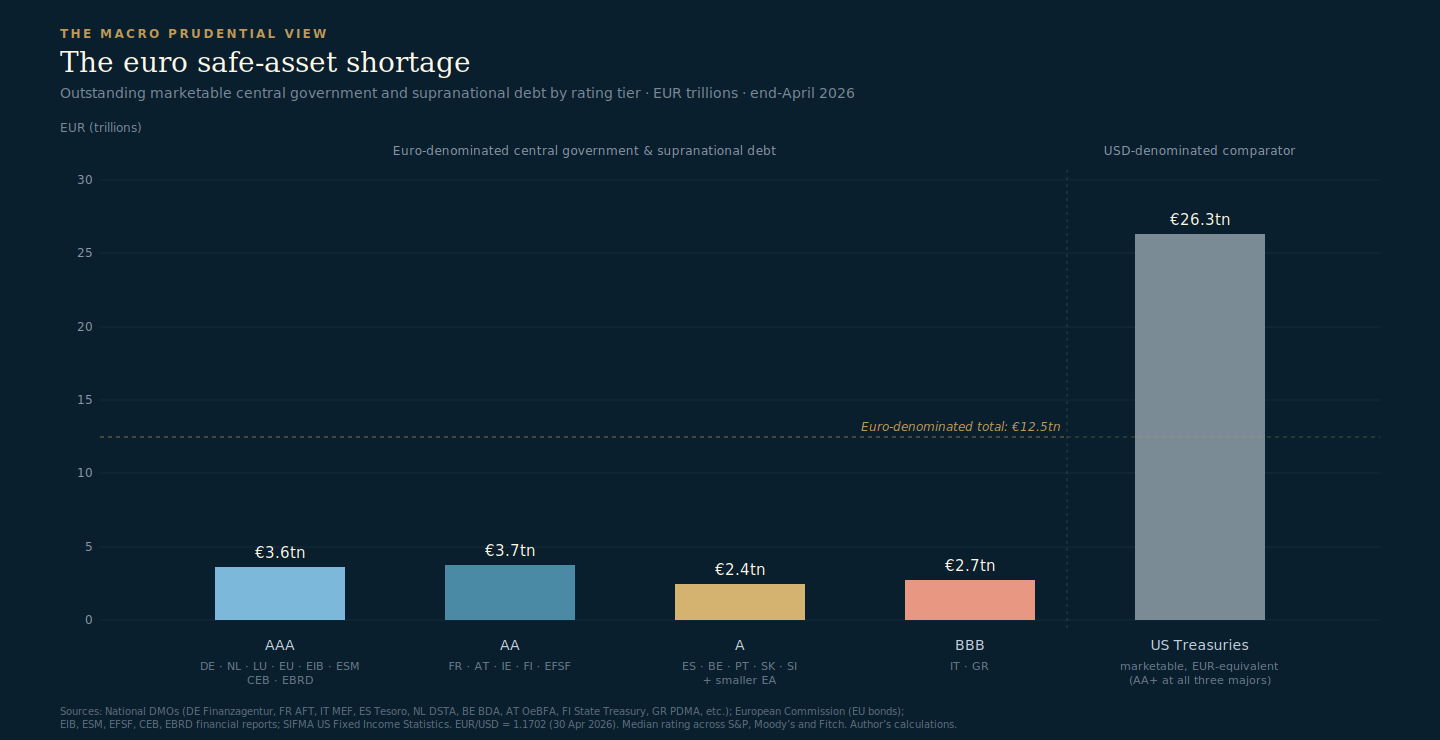
Euro-denominated marketable central government and supranational debt totals roughly €12.5 trillion at end-April 2026. Across all rating tiers — from German Bunds to Greek GGBs, from EU NGEU bonds to ESM and EFSF — that is the entire potentially-safe stock available to the euro area. By comparison, US marketable Treasuries total around $30.8tn at end-March 2026, or €26.3tn at the prevailing exchange rate. The euro stock is roughly 47% of the size of the US benchmark.
Cut to strict AAA — the rating that would, in principle, anchor the system — and the picture sharpens. Germany, the Netherlands, Luxembourg, plus the AAA-rated supranationals (the EU at S&P AA+ but Aaa/AAA at the other three majors; EIB, ESM, CEB, EBRD all clean AAA) sum to about €3.6tn. That is roughly one-seventh the size of the US Treasury market.
Even on a more permissive cut — AAA plus AA, putting France in the AA bucket on the basis of Moody’s Aa3 (S&P and Fitch downgraded France to A+ in 2025) — the total reaches €7.4tn. Still well under a third of the US benchmark.
The composition makes it worse. The bulk of euro-denominated sovereign issuance is rated A or BBB: Italy at €2.6tn dominates the BBB tier; Spain, Belgium, Portugal and the smaller member states populate the A tier. Around 40% of the euro safe-asset universe is below AA. That is not a structural feature you can engineer your way out of by issuing more national bonds.
This is what Lane refers to as the structural undersupply of “safe-asset services” — and what the supranational layer (NGEU, EU bills, EIB issuance, the ESM/EFSF stack) has been quietly trying to address since 2010. EU-Bonds outstanding now sit just over €700bn, of which roughly €450–500bn is NGEU-related, with the borrowing window closing at end-2026 and repayments beginning from 2028. Without successor programmes, the EU bond stock will start shrinking just as the structural arguments for a larger one intensify.
Is anything safe in 2026?
The shortage is real. But it is also worth asking what, exactly, is in short supply.
Lane’s keynote followed the standard working definition in the literature: a safe asset is highly liquid and appreciates in relative value under stress. The formulation packs three distinct properties into one phrase. Credit safety: the issuer pays. Market liquidity: holders can transact at low cost in size, including under stress. Hedging: the asset gains value when other things fall, so it offsets portfolio losses. The full definition requires all three. Failure on any one dimension means the asset is not, by Lane’s own standard, fully safe.
The textbook reference points all clear the credit dimension comfortably. None of them clears all three reliably.
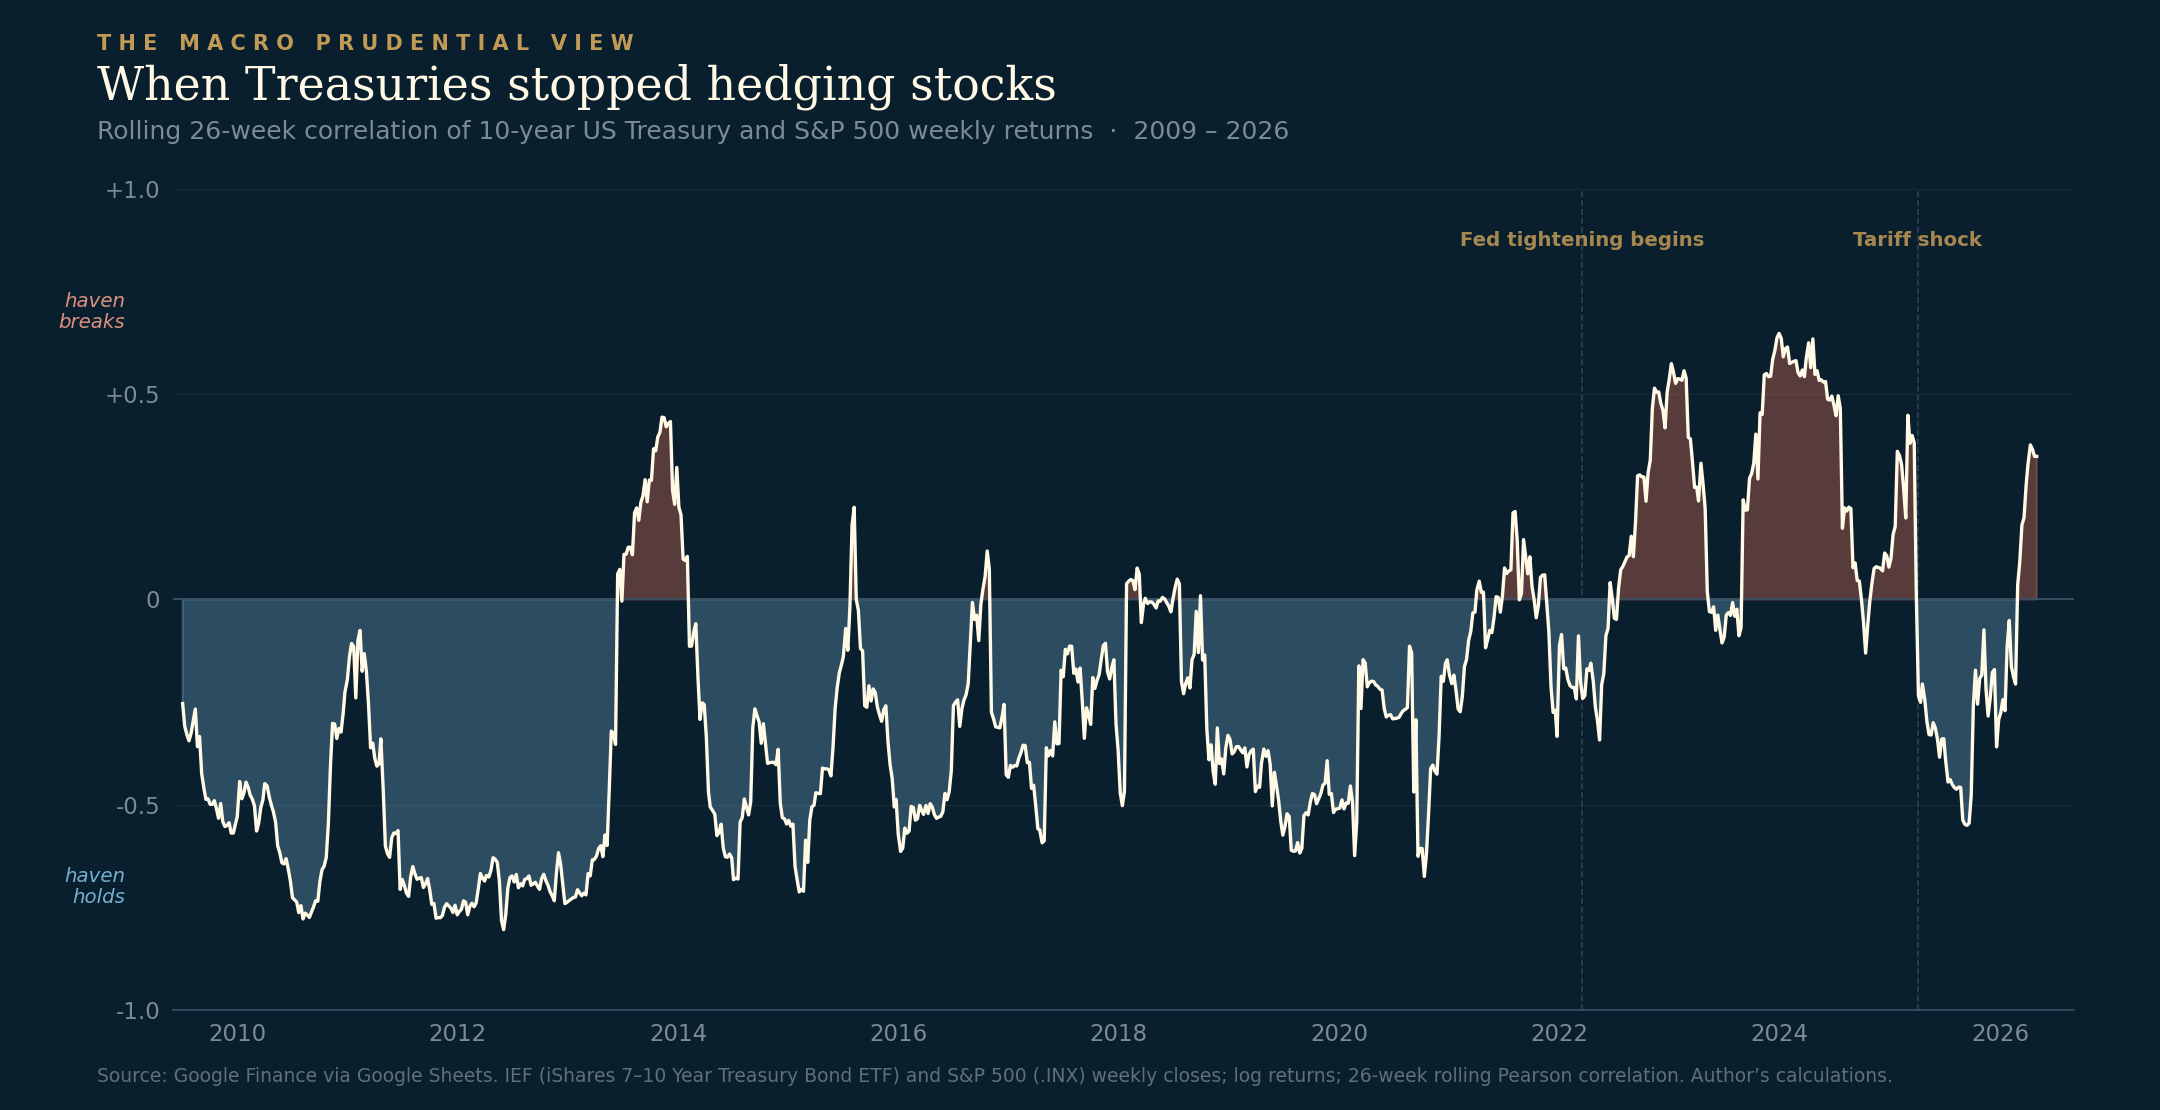
US Treasuries are the obvious case. The chart shows the rolling 26-week correlation between weekly returns on the 7–10 year Treasury ETF and the S&P 500 since 2009. The classic safe-haven property — Treasuries rising when equities fall — produces a negative correlation. Through the 2010s, the correlation sat consistently between –0.3 and –0.7. From 2022 onward, it inverted. Annual averages turned positive in 2023 and 2024. The April 2025 tariff shock, the SVB/Credit Suisse moment in March 2023, and the broader inflation-shock regime have all coincided with episodes where Treasuries failed to hedge.
Darrell Duffie’s recent JEP piece attributes this to a combination of dealer balance-sheet constraints, fiscal trajectory, and regulatory capital limits compressing intermediation capacity at exactly the moments when liquidity provision matters most. The credit dimension is intact — the US is one notch below AAA at all three majors after Moody’s downgraded to Aa1 in May 2025 (S&P and Fitch are at AA+), but no one is pricing actual default risk. The breakdown is in liquidity and hedging, the second and third dimensions of Lane’s definition. None of this changes the fact that Treasuries still dominate other sovereign assets in scale and breadth of usage. The hierarchy is not gone; it is just less reliable than it was.
The other pillars look no better when scrutinised on the same three dimensions.
Bunds function as a regional rather than global safe asset, anchoring euro-area portfolios but not (in the way Treasuries do) global ones — a point established empirically in the ECB’s recent work on bond substitution patterns. Germany’s fiscal turn since 2023, with the constitutional debt brake reform and ramped defence and infrastructure spending, has not threatened the AAA rating but has materially altered the supply-and-demand framing.
Gilts, in 2022, demonstrated that an asset can pass the credit test cleanly and still fail the market-functioning test. The Bank of England’s anatomy of the LDI crisis documents how liability-driven investment unwinds drove extreme moves in long-dated gilts despite no shift in UK creditworthiness. The asset was safe; the market was not.
JGBs are the inverse case: credit fine, liquidity impaired by years of BoJ purchases. As FRBSF research and AMRO’s 2025 work document, the BoJ’s footprint has hollowed out functioning JGB markets even as it tapers; the liquidity premium has risen, and the question of who replaces the central bank as marginal holder remains open.
The synthesis is uncomfortable but unavoidable. The frame established by Gorton (2017) — safe assets as instruments “always valued at face value without expensive information production” — was always context-dependent. What counted as safe in 2011 is not what counts as safe in 2026. None of the four canonical sovereign safe assets currently passes all three of Lane’s dimensions across all regimes. Safety has become contingent, regime-dependent, and dependent on the institutional and market-structure context surrounding each asset.
This sharpens the European policy question rather than dulls it. A diversified, properly engineered safe asset has the potential to be more robust on at least one of these dimensions — diversification protects against single-issuer fiscal trajectories, single-jurisdiction market structure failures, or single-central-bank footprints. The rest of this piece works through what the engineering options actually look like.
Three reform paths — and the status quo
Lane’s keynote walked through three broad routes to expanding euro safe-asset supply, alongside the implicit baseline of continuing with what we have. Each rests on a different combination of financial engineering, fiscal commitment, and political appetite.
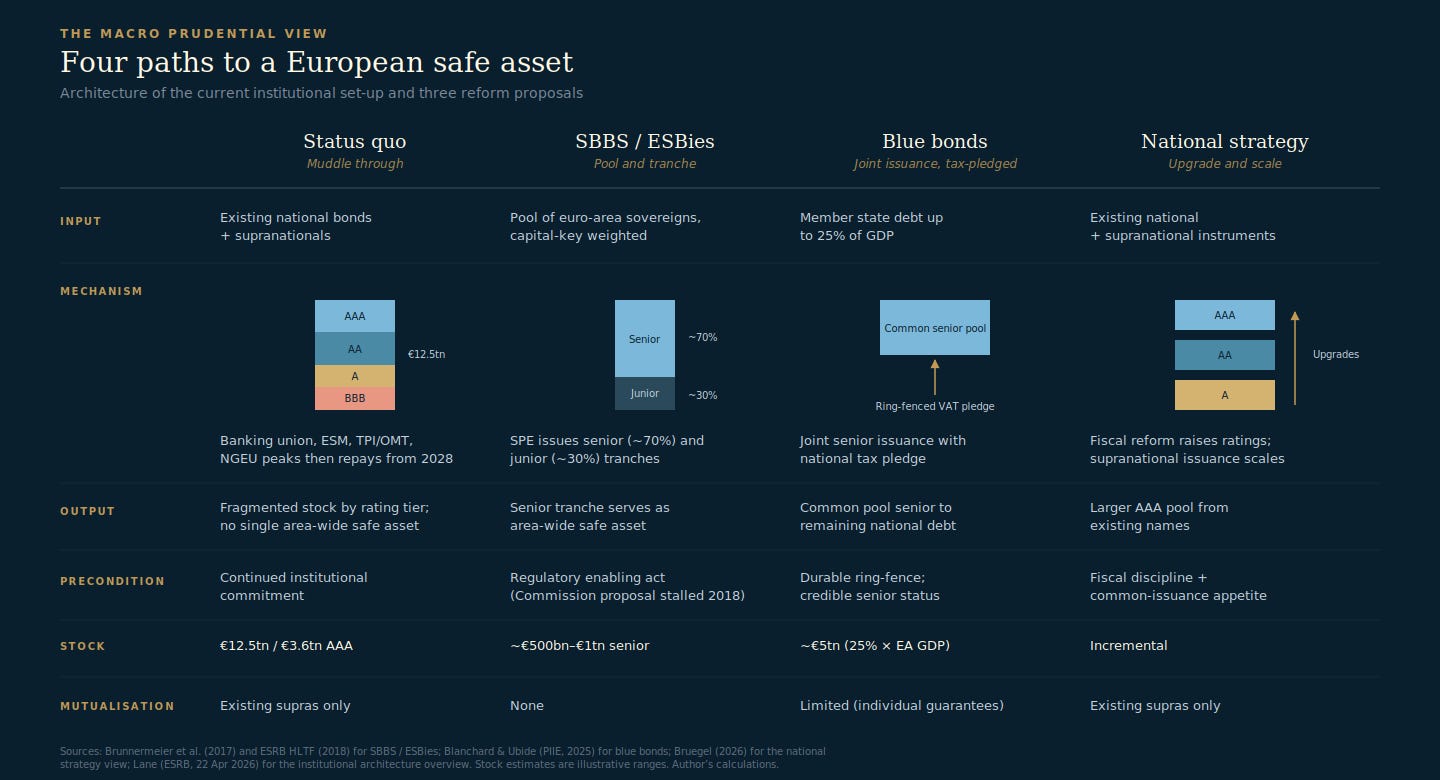
The four designs differ not just in volume but in the kind of safety they deliver and the political capital they consume:
The status quo continues the trajectory that began with banking union in 2014 and accelerated with NGEU in 2020. Banking union, ESM standing facility, TPI/OMT, NGEU borrowing — all of these have, incrementally, expanded the supranational safe-asset layer. The mechanism is institutional: build credibility and capacity at the European level, issue more bonds against it. It produces the existing fragmented stock by rating tier (€12.5tn total, €3.6tn AAA), and it keeps producing more — NGEU alone added several hundred billion in high-quality supply over five years. The precondition is continued institutional commitment.
SBBS / ESBies — the proposal advanced by Brunnermeier, Langfield, Pagano, Reis, Van Nieuwerburgh and Vayanos (2017) and developed in detail by the ESRB High-Level Task Force on Safe Assets in 2018 — pools euro-area sovereign bonds in capital-key weights. A special-purpose entity issues two tranches against them: a senior tranche (typically 70% of face value), which serves as the area-wide safe asset, and a junior tranche (the remaining 30%), which absorbs first losses. No mutualisation: each member state continues to service its own debt. The senior tranche’s safety comes from diversification and subordination, not from joint guarantees. The precondition is regulatory — a Commission proposal in 2018 stalled, but the technical work is largely complete.
Blue bonds, in Olivier Blanchard and Ángel Ubide’s 2025 PIIE proposal, take the opposite direction. Convert each member state’s debt up to 25% of GDP into jointly-issued senior bonds, with each member ring-fencing a tax stream (VAT being the canonical example) to service its share. The output is roughly €5tn of senior, jointly-marketed paper — the largest single design by far, comparable in scale to the German Bund market. The precondition is durable political commitment to ring-fenced revenues and a credible legal architecture for the senior claim. Mutualisation is limited but real: individual rather than joint-and-several guarantees, but a much closer version of common debt than anything in the status quo.
The national strategy — the path advocated by Bruegel — argues that scaling existing supranational issuance and pursuing fiscal reforms to upgrade individual sovereigns toward AAA could deliver more usable safe-asset stock than tranching or blue bonds in the medium term. No new instrument. The mutualisation profile is identical to the status quo — existing supranational mechanisms continue, just at larger scale. The output is incremental.
Hanno Lustig’s argument deserves to be heard on this point. Lustig’s analogy is to the United States in the 1840s: state defaults were politically wrenching but ultimately disciplinary, contributing to the constitutional balanced-budget rules that anchor American state finance today. Europe, by contrast, has consistently chosen the bailout-and-ECB-balance-sheet path. Joint debt without binding fiscal constraints, in Lustig’s reading, is not a Hamiltonian moment — it is a deferral. The moral hazard concern is not about the design itself but about whether the supporting fiscal architecture can hold. Lustig’s argument applies most directly to blue bonds, where the senior claim relies precisely on the durability of national tax-revenue ring-fences over multi-decade horizons.
These four paths are genuinely different on every dimension that matters. They produce different volumes (incremental versus €1tn versus €5tn versus open-ended). They require different preconditions (institutional continuity versus regulatory enabling act versus political tax-pledge commitment versus fiscal discipline). They imply different degrees of mutualisation (existing only, none, limited individual guarantees, existing only). And they leave different residual risks for the domestic financial system.
The doom loop hasn’t gone away
Why does this matter beyond the academic case for more diversified safe assets? Because the bank-sovereign nexus that motivated banking union in the first place has not weakened.
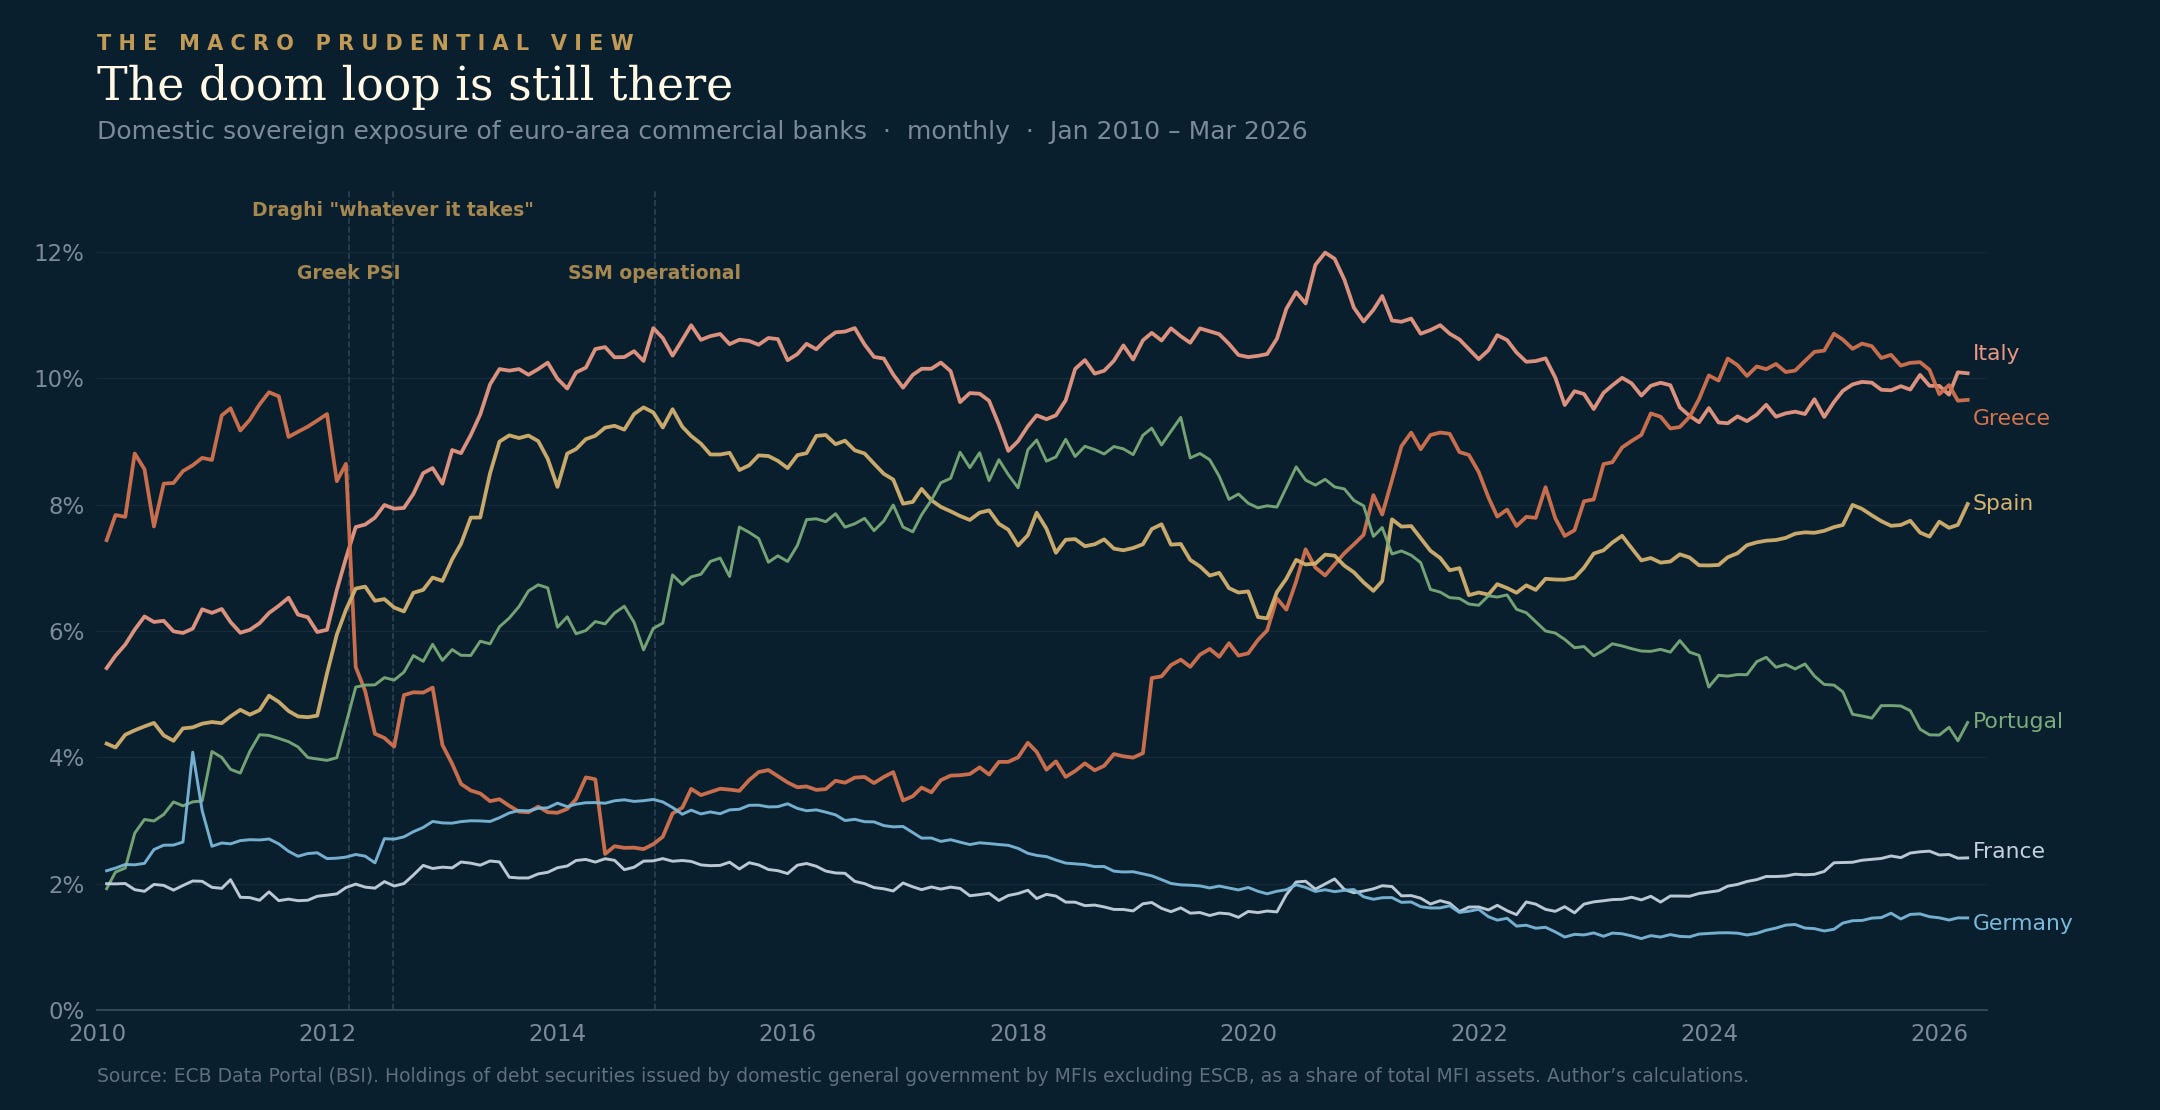
The chart plots holdings of domestic government debt by commercial banks (MFIs excluding the ESCB, so stripping out PSPP and PEPP holdings on the central-bank side) as a share of total bank assets, monthly since 2010. Six countries: the four major peripherals — Italy, Spain, Portugal, Greece — and France and Germany as core comparators.
The data tells a sharper story than the institutional reform narrative would suggest. Italian banks hold around 10% of their assets in Italian government debt, with the all-time peak — 12% — reached in August 2020, during the COVID-era issuance surge. Greek banks rebuilt their domestic exposure from near-zero post-PSI to 9.7% by January 2025 — also an all-time high. Spanish banks have sat in the 7–9% range for over a decade. Only Portugal shows a clear de-risking, from a 9.4% peak in 2019 to 4.6% currently. France is creeping up. Germany is the only country meaningfully below its 2010 starting point.
OMT (July 2012) and the SSM (November 2014) are marked on the chart. Neither has materially bent the trajectory of any line. The 2012 Greek PSI is also visible — it is the only intervention on the chart that produced a structural break, and the cliff in the Greek line shows it. Twelve years of European banking-union architecture has not, on its own, produced a comparable structural break in any other country.
This is the macroprudential case for some safe asset, regardless of which design wins. Domestic banks in the periphery hold ten percent of their balance sheets in their own sovereign — and this share is at or near multi-decade highs. A genuine area-wide safe asset, held in place of concentrated domestic exposure, would mechanically dilute this concentration. The status quo has not resolved this problem; in some countries it has coincided with record exposures over the past five years.
What financial economics says about tranching
Of the three reform paths, SBBS / ESBies is the design where financial economics has the most to say. Blue bonds and the national strategy both turn on questions of political commitment and fiscal discipline that economic analysis can illuminate but not resolve. SBBS turns on a structural property of pooling and subordination that can be calibrated, simulated, and stress-tested.
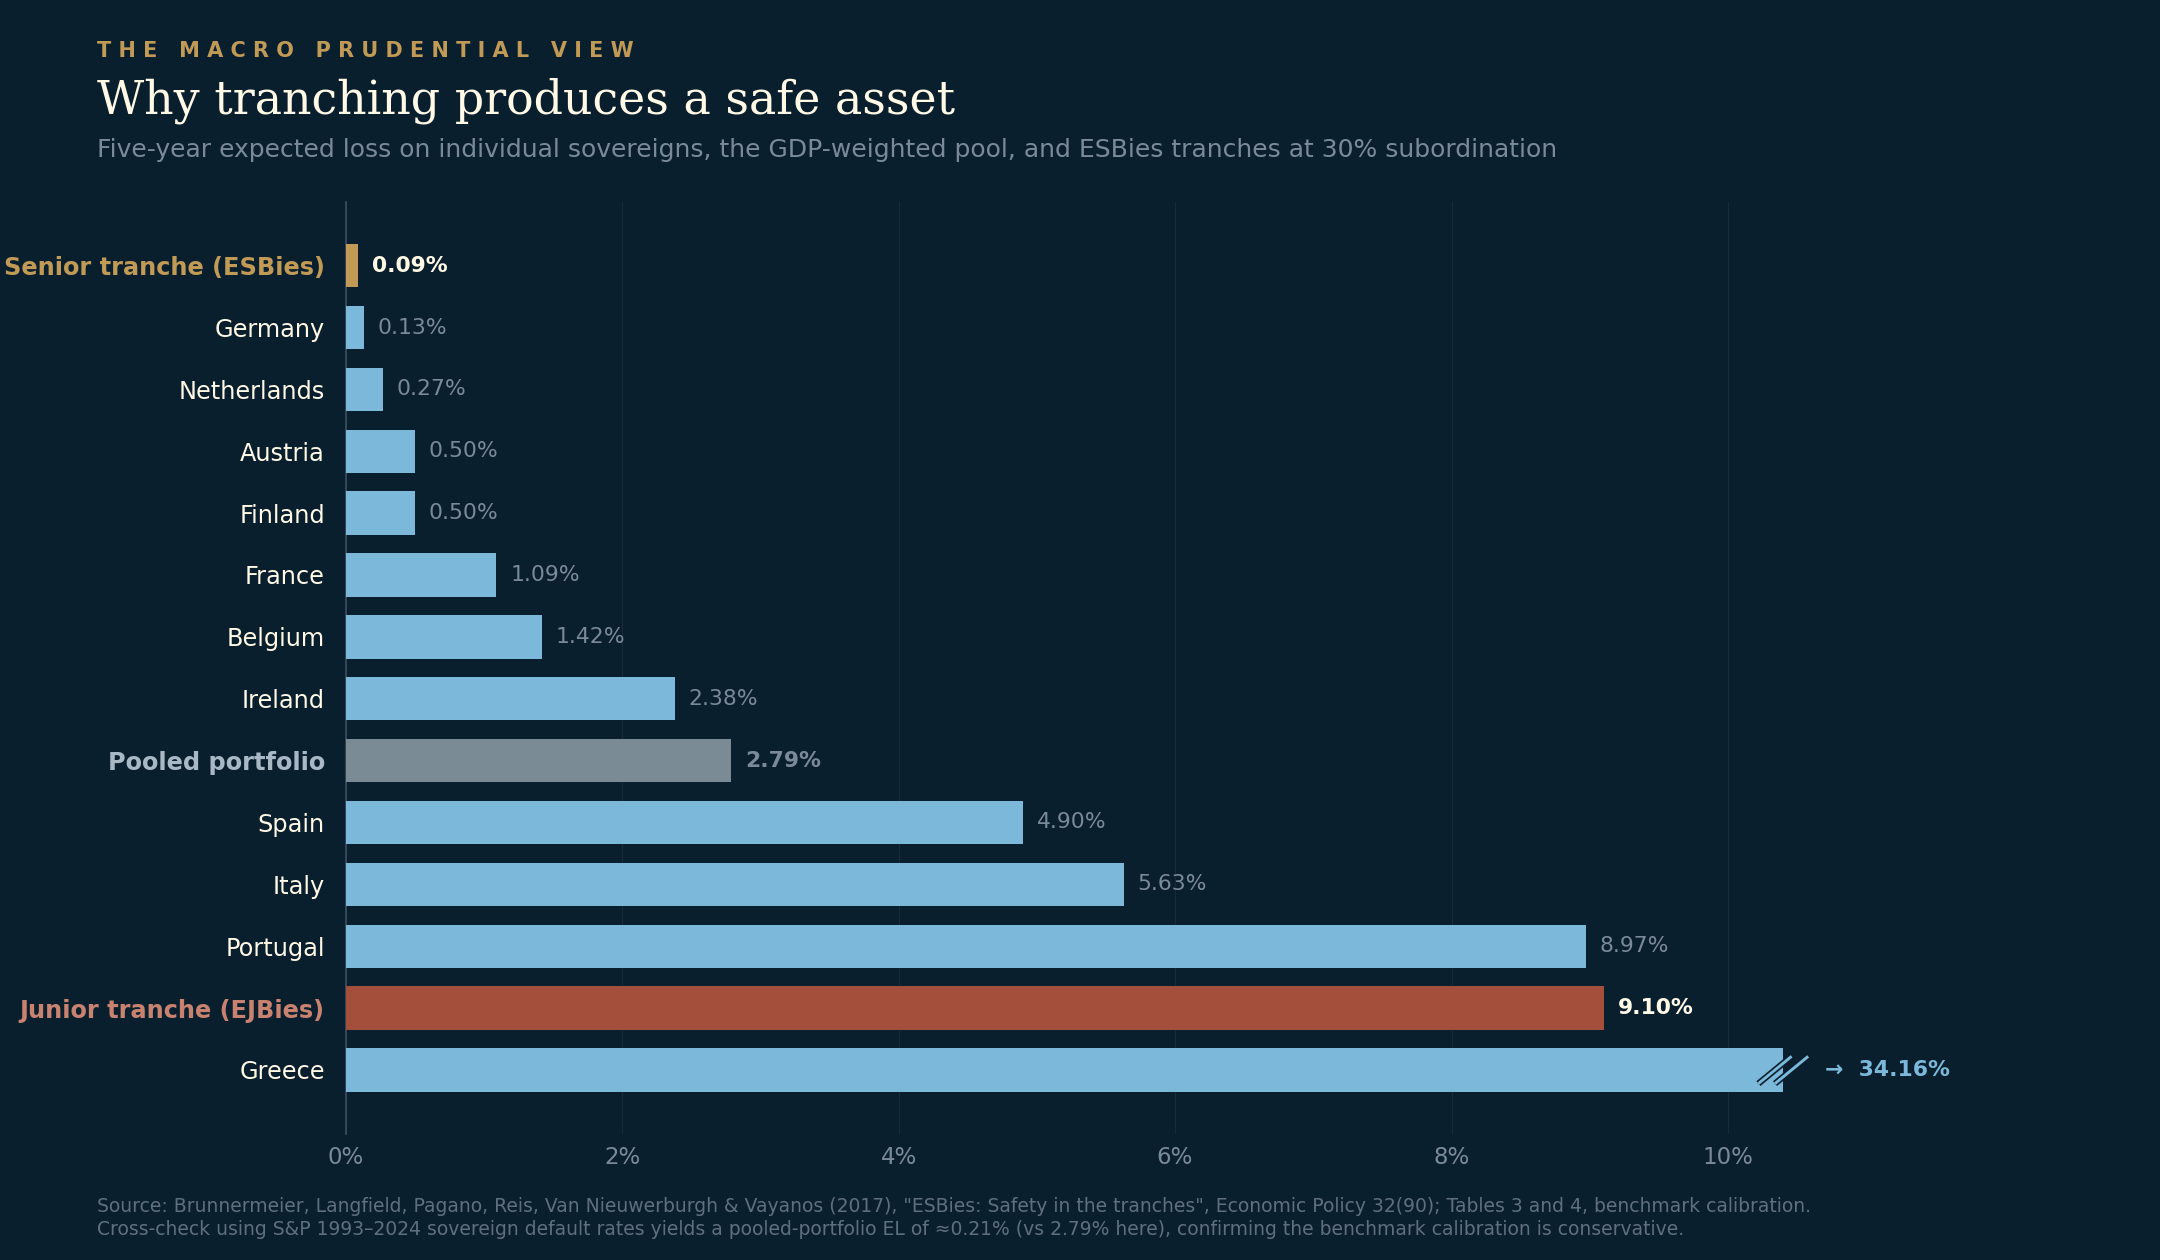
The chart reproduces the benchmark calibration from Brunnermeier et al. (2017), Tables 3 and 4. The numbers are five-year expected losses on individual sovereigns and the engineered tranches.
The headline result: under the benchmark calibration, the senior tranche of a 30%-subordinated, GDP-weighted euro-area sovereign pool has a five-year expected loss of 0.09%. The safest individual sovereign, Germany untranched, has an expected loss of 0.13%. Tranching, applied to a diversified pool, produces an asset safer than any of its underlying components — without any mutualisation between member states.
The mechanics are not mysterious. The pool is GDP-weighted, so no single sovereign dominates. The senior tranche only takes losses once cumulative losses on the underlying pool exceed 30% — and given even modest correlation assumptions, the probability of cumulative euro-area sovereign losses breaching that threshold within five years is very small. The junior tranche absorbs the residual. The cross-check holds: 70% × 0.09% senior + 30% × 9.10% junior = 2.79%, exactly the GDP-weighted pool’s expected loss before tranching. The engineering is conservation of risk, not its disappearance.
A note on vintage: the Brunnermeier calibration uses December 2015 sovereign ratings. Since then, several sovereigns have moved — upgrades for Greece, Italy, Spain and Ireland; downgrades for France, Belgium, and others. A cross-check using S&P’s 1993–2024 historical local-currency sovereign default rates by rating bucket and current ratings yields a five-year pooled-portfolio expected loss of approximately 0.21% — well below Brunnermeier’s 2.79%. The difference reflects Brunnermeier’s use of stress-conditioned forward-looking PDs versus S&P’s unconditional realised rates. The benchmark calibration is therefore conservative. Under more benign assumptions, the senior tranche’s safety properties only improve.
This is what Lane meant by “safe-asset services.” A senior SBBS tranche, by construction, has credit risk lower than any individual euro-area sovereign. It has the regulatory tractability that comes with a single instrument standardisable across jurisdictions. And it has the structural diversification that matters in 2026: no single fiscal trajectory, no single market microstructure, no single central bank footprint determines its safety properties. The dimensions that Treasuries, Bunds, gilts, and JGBs each fail in their own way — the senior tranche, by construction, is more robust against them all.
Synthesis and open questions
Five charts and four designs into this article, what does the analytical case look like?
The shortage is real. Euro-denominated marketable central government and supranational debt is roughly half the size of the US Treasury market, and the strict-AAA subset is a seventh. The composition is heavily weighted toward A and BBB sovereigns. The supranational layer is currently growing but is structurally programmed to peak in 2026 and shrink from 2028 unless successor programmes are agreed. This supply cliff arrives at the same time as the ECB’s balance-sheet normalisation, with private markets absorbing more sovereign debt as the central-bank footprint shrinks.
The case for more safe-asset supply is reinforced, not weakened, by the observation that “safety” is contingent and multi-dimensional in 2026. Existing global benchmarks — Treasuries, Bunds, gilts, JGBs — each fail at least one of Lane’s three dimensions in some regime. A diversified, structurally engineered euro safe asset has different failure modes than any single-sovereign benchmark. That is not a marginal advantage in a world of fragmentation, geopolitical shocks, and divergent monetary policy paths.
The bank-sovereign nexus has not weakened, twelve years into banking union. Italian and Greek banks now sit at all-time-high domestic sovereign exposures, hit in 2020 and 2025 respectively. SBBS, by construction, dilutes this concentration without requiring any sovereign to cede fiscal sovereignty.
On the engineering, the financial economics is robust. A senior tranche of a diversified, capital-key-weighted euro-area sovereign pool, with 30% subordination, has a five-year expected loss lower than Germany untranched. The result holds under both the conservative Brunnermeier calibration and the more benign historical-default cross-check. No mutualisation is required. No fiscal commitment beyond the existing one is required. The precondition is a regulatory enabling act that the Commission has already drafted and that has been on the European policy shelf since 2018.
What the analysis cannot resolve is the political question. Blue bonds promise the largest stock — €5tn — but at the highest political cost: durable national tax-revenue ring-fences and individual guarantees backing a senior pool that legally subordinates remaining national debt. Lustig’s moral-hazard concern, transposed from the American 1840s, is that joint debt without binding fiscal discipline is unstable. The national-strategy path requires a degree of sustained fiscal consolidation that has historically proven difficult to maintain across multiple electoral cycles. The status quo continues to produce supranational issuance, but at a pace that may not match the volume Lane and Rehn argue is needed.
There are also things financial economics cannot tell us. Whether investors will buy the junior tranche of an SBBS structure at sustainable yields is an empirical question — it has not been tested at scale, and the ESRB HLTF’s 2018 survey of market participants found stronger interest in the senior tier than the junior. Whether the senior tranche, even at 0.09% expected loss, receives AAA-equivalent treatment for bank capital and ECB collateral purposes depends on regulatory choices that have not been made — and it is one of the choices the 2018 Commission proposal was designed to enable. Whether Europe’s political appetite for any of the three reform designs has materially changed since 2018 is a question about institutions, not models.
Lane’s keynote suggests that the technical groundwork for the main designs is largely in place. The ECB has been building adjacent infrastructure for the euro’s international role — TPI for managing sovereign-spread fragmentation, the expanded EUREP facility providing euro liquidity to non-euro-area central banks — but the safe asset itself remains the missing piece.
The 2018 ESBies proposal stalled because the volumetric and macroprudential urgency was not yet sufficient to overcome the political friction. The numbers in this piece — €3.6tn AAA stock, doom-loop exposures at multi-decade highs, the continuing erosion of the global safe-asset hierarchy — suggest the calculus may be different in 2026.
Paweł Fiedor - The Macro Prudential View
The views expressed here are personal and do not represent the views of the European Systemic Risk Board.
Charts compiled from: Brunnermeier, Langfield, Pagano, Reis, Van Nieuwerburgh and Vayanos, “ESBies: Safety in the tranches”, Economic Policy 32(90), 2017; Blanchard and Ubide, “Now is the time for Eurobonds: A specific proposal”, PIIE, 2025; the ESRB High-Level Task Force on Safe Assets, 2018; Bruegel, “Don’t look only to Brussels to increase the supply of safe assets in the EU”; Lustig, “Blue Bonds in Europe”, The Two Cents; Duffie, “How US Treasuries Can Remain the World’s Safe Haven”, Journal of Economic Perspectives, 2025; Gorton, “The History and Economics of Safe Assets”, NBER Working Paper, 2016; Bank of England, “An anatomy of the 2022 gilt market crisis”, 2023; the European Commission’s EU as an issuer page; national debt management offices for sovereign bond and bill stocks (Deutsche Finanzagentur, Agence France Trésor, MEF/Banca d’Italia, Tesoro Público, DSTA, Belgian Debt Agency, OeBFA, Finnish State Treasury, NTMA, IGCP, PDMA); ESM, EFSF, EIB, CEB, EBRD financial reports; the AFME Government Bond Data Report Q4 2025; SIFMA’s US Fixed Income Securities Statistics; the ECB Data Portal (BSI dataset); S&P Global Ratings, “Default, Transition, and Recovery: 2024 Annual Global Sovereign Default and Rating Transition Study”; rating actions verified against issuer investor-relations pages and the Wikipedia List of countries by credit rating. Lane and Rehn speeches as referenced. Author’s calculations throughout.