



A new BIS paper finds that bank–sovereign risk co-movement has become more closely associated with banks’ non-bank exposures. The European holder data show why the transmission chain cannot be reconstructed from any published dataset.
In mid-July, the French ten-year briefly traded through the Italian one. The OAT yield reached 3.94% on 15 July, its highest since June 2009; at monthly close, France’s spread over Bunds was near 80 basis points, against Italy’s 83. The same week, the Bank for International Settlements published a working paper — Avdjiev, Hardy and Jager, “The evolving nexus: sovereigns, banks and NBFIs”, dated 14 July — arguing that the sovereign-bank doom loop of the euro area crisis has not closed so much as changed its plumbing. And the Financial Stability Board’s Nonbank Data Task Force, chaired by Andrew Bailey, is due to report by mid-2026 on its test case: leveraged trading strategies in sovereign bond markets, chosen precisely because authorities cannot currently see who runs them, at what leverage, financed by whom. As I write, the measurement problem this piece describes has outlived the task force’s own timetable.
This piece takes the BIS result and asks where its channel lives in the European data. The answer is uncomfortable in a specific way: the published datasets cannot tell us which leg of the channel matters most once risk passes between sovereign holders, non-banks and their bank counterparties.
The paper, and the map
The BIS paper does something clean. Using EBA bank-level data and the BIS consolidated banking statistics, it shows that before 2016, banks whose sovereign holdings were larger co-moved more tightly with their sovereigns — the classic result, the mechanism the euro area crisis made famous. After 2016 that relationship weakens significantly. In its place, banks’ exposures to the financial sector — and, where the data allow NBFIs to be separated, to NBFIs — become a significant determinant of the co-movement, strongest for high-risk counterparty countries, even as direct bond holdings matter less. The authors find the same pattern at the country level; find the post-2016 financial-exposure link stronger for periphery banks holding more liquid assets, a pattern the paper itself reads as consistent with short-term repo lending to leveraged NBFIs; and find it on the liability side too, through the deposits NBFIs place with banks, in a shorter sample beginning in 2019 when those data start.
Call the first arrangement the first geography: the domestic feedback most legible in the post-crisis disclosure and sovereign-exposure metrics — banks holding their own sovereign. The paper finds that the measured association has shifted away from direct holdings toward NBFI-related exposures.
The paper is also candid about what it cannot see. Its NBFI exposure measure is proxied from financial-sector exposures, refined with a non-performing-loan share; its NBFI-sovereign leg exists only for domestic holdings, because cross-border data on who holds what, levered how, does not exist in usable form. That confession is the door this piece walks through.
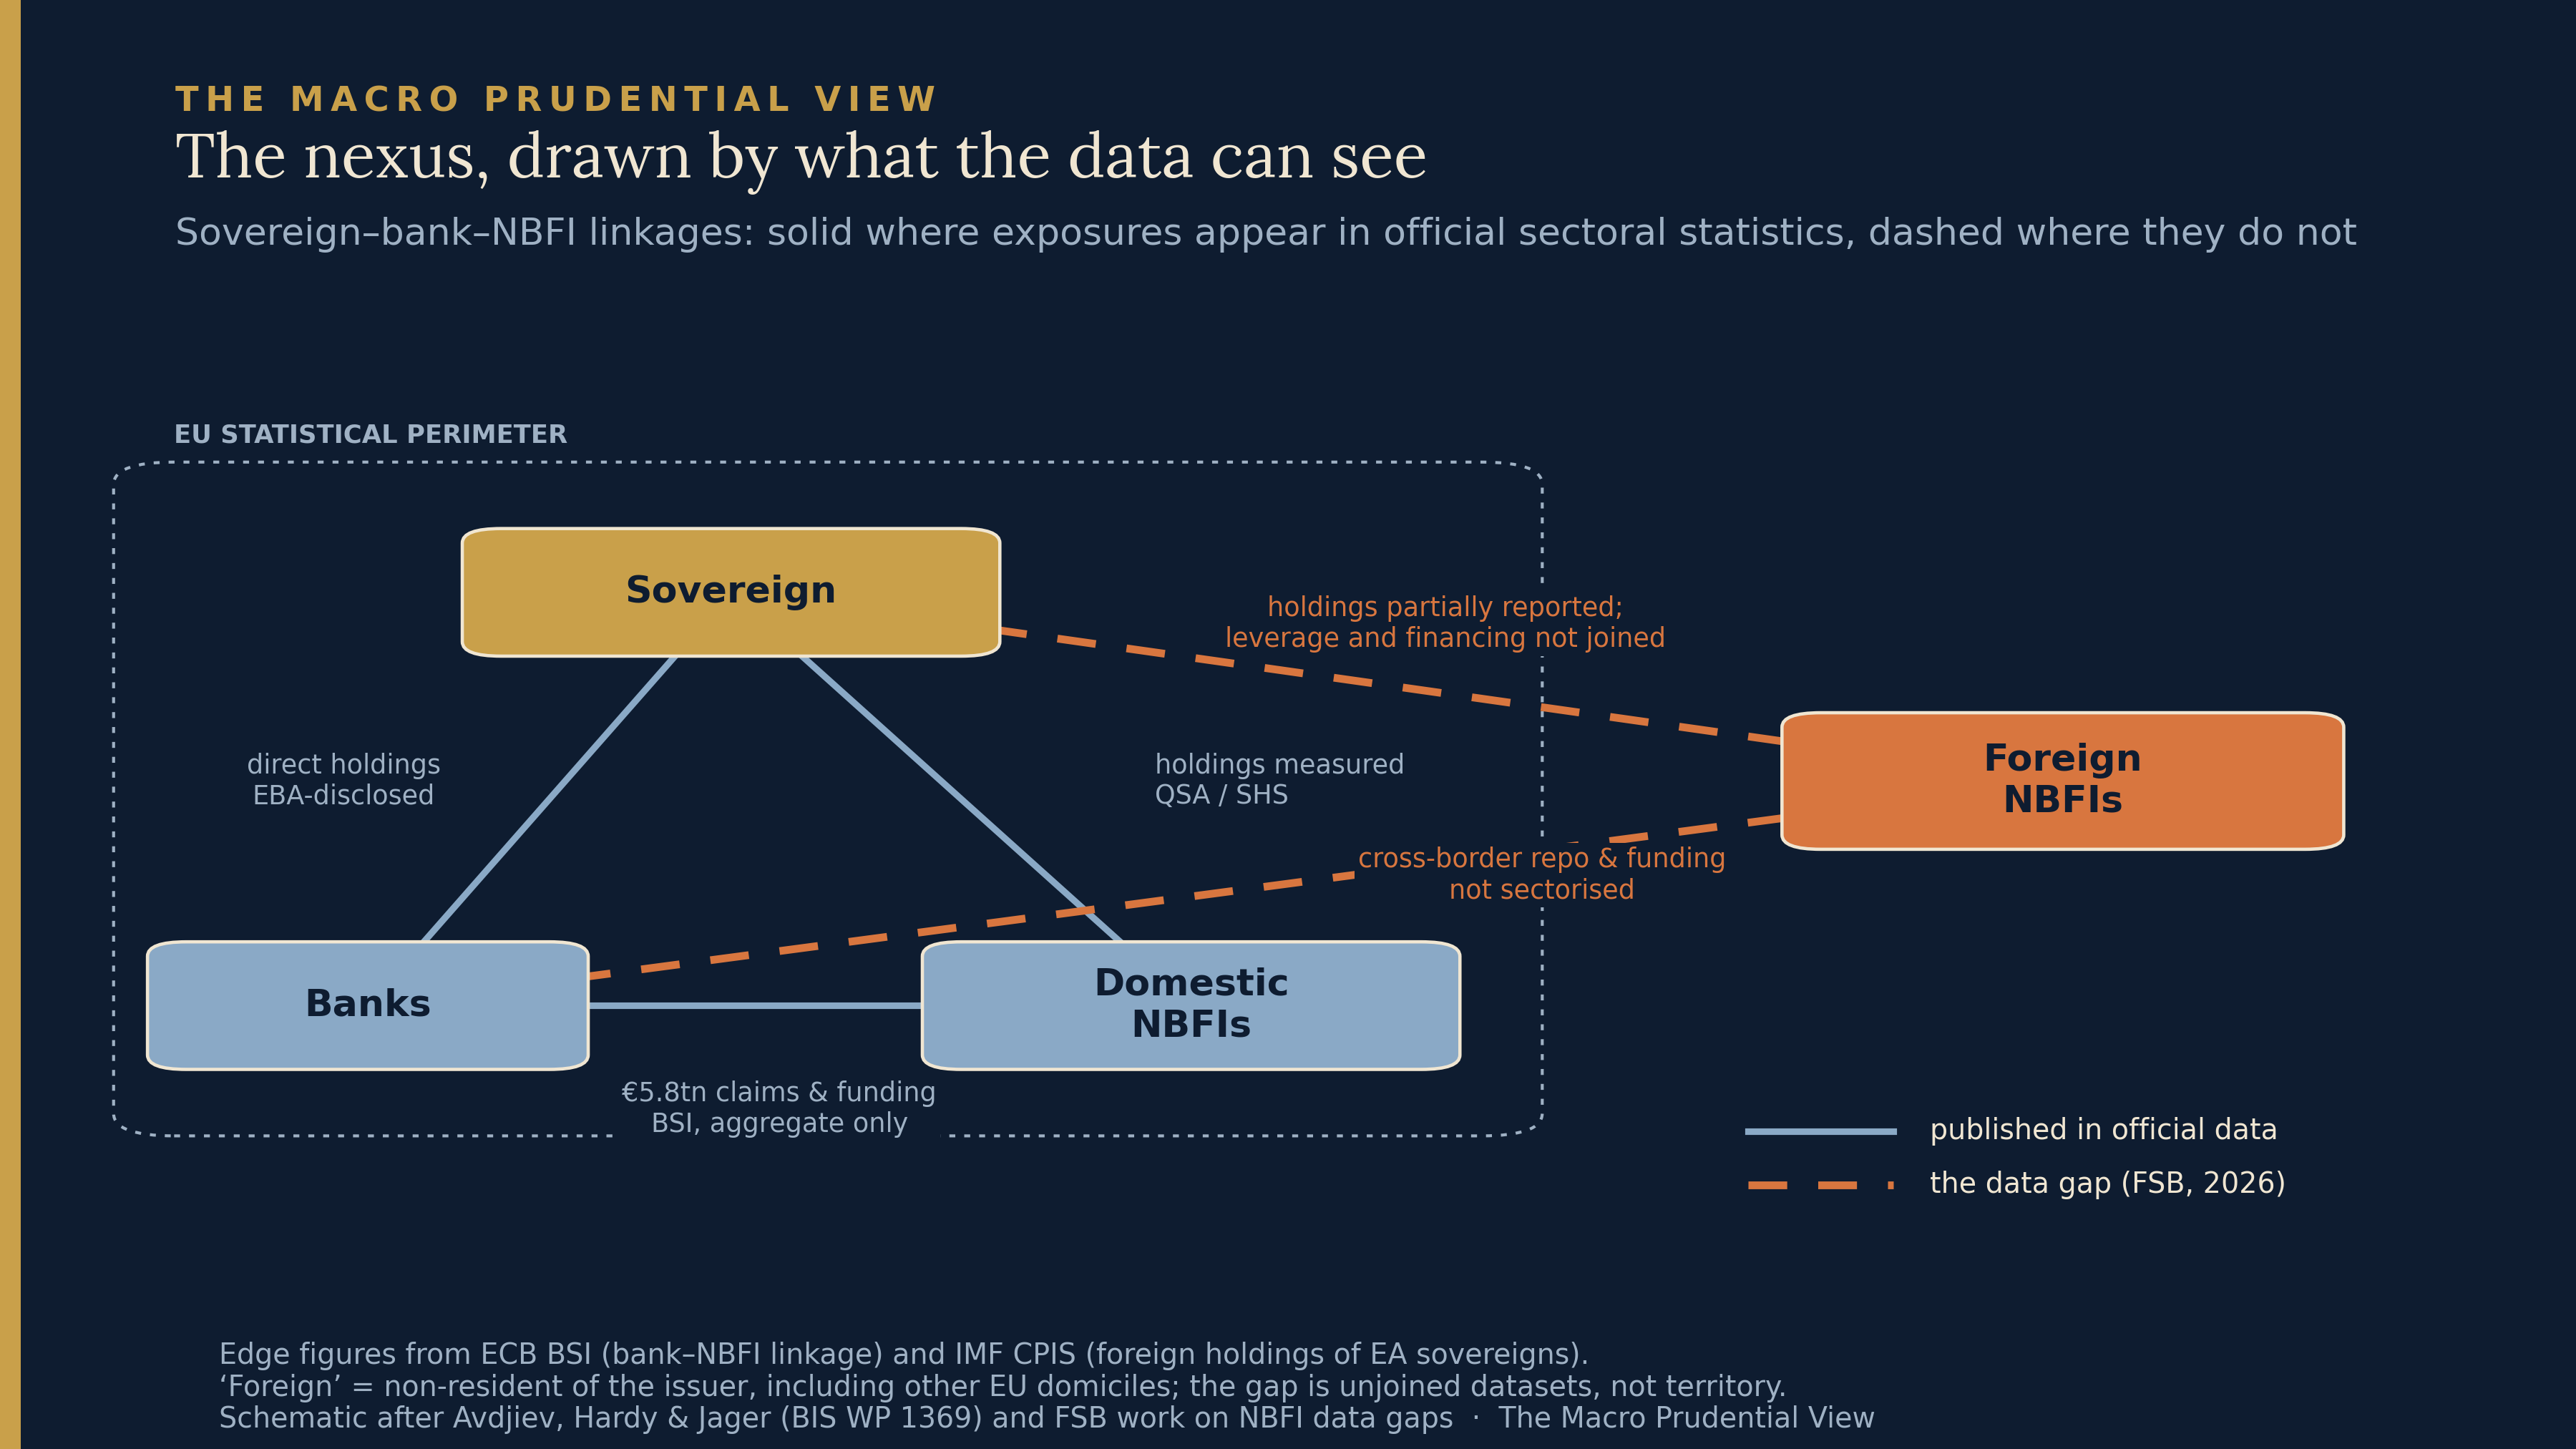
The next sections test how far published holder and balance-sheet data can trace those dashed edges, and where they stop.
Where the bonds went
Start with the intuitive version of the story: banks sold their sovereign bonds, non-banks bought them, the risk moved house. The euro-area holder data refuse to cooperate.
The ECB’s who-to-whom accounts let us decompose who holds the general government debt securities of the old periphery — Spain, Greece, Ireland, Italy, Portugal — from 2015 onwards. Domestic banks did step back: from 22% of the total to 15.5% by early 2026. But domestic non-bank financial institutions stepped back further, from 19% to 10.5% — and not only in shares. Italian domestic NBFIs held roughly €453bn of Italian government paper at end-2015 and hold about €327bn now.
The eleven-year window contains two distinct ownership configurations. During QE, the Eurosystem’s share rose above 30% as the non-resident residual declined from around 41% to 31%. Since 2022, as Eurosystem holdings have run off, the non-resident share has rebuilt to roughly 39%. The aggregate series cannot identify the marginal buyers behind that change.
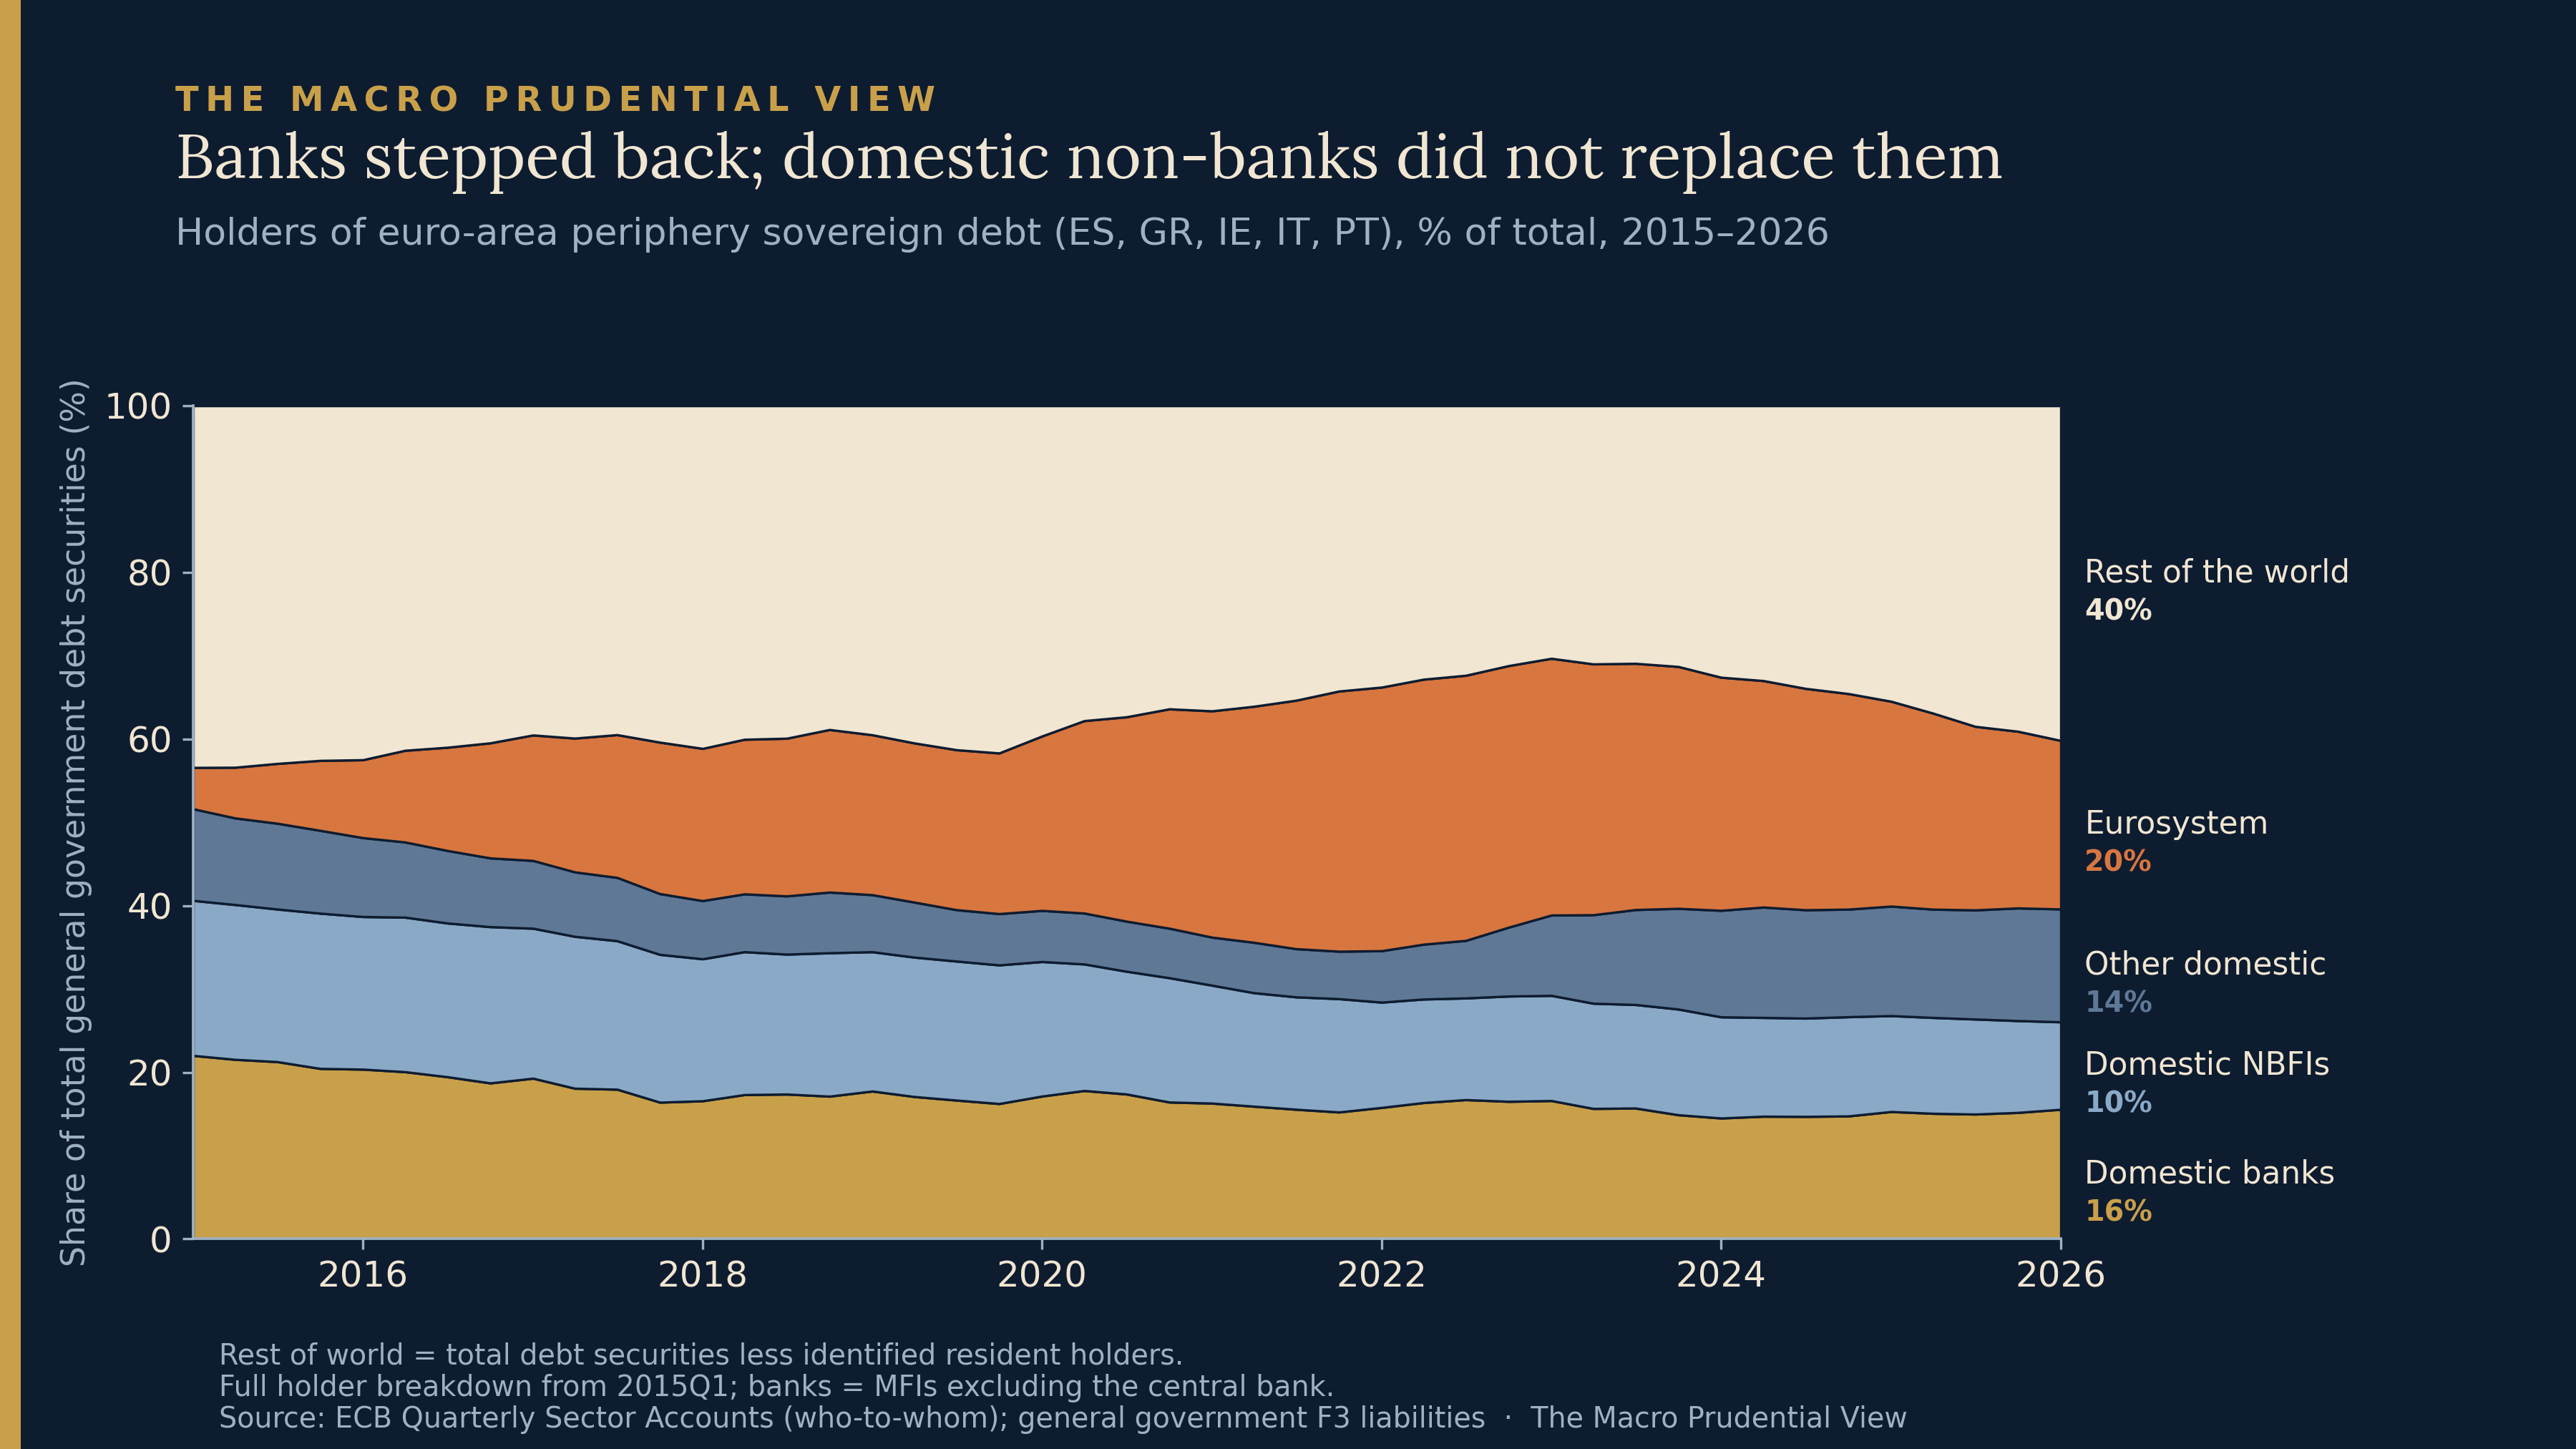
The holder data therefore rule out the simple story. Domestic non-banks did not replace banks as the larger holders of periphery debt. That is worth being precise about, because it does not rule out domestic NBFIs as a transmission channel: they still hold three hundred billion euros of Italian paper, and the BIS result works through the interaction of existing holdings with sovereign risk, not through purchases. What the shares refute is replacement. If the BIS channel operates in Europe, it runs less through visible domestic cash holdings than through financing, collateral and cross-border intermediation — which is where the published data begin to thin.
One flow number sharpens the stock picture, though it concerns France rather than the periphery sample above, and it is a flow, not a holding: the French Treasury’s financing programme for 2026 provides for €310bn of medium- and long-term issuance net of buybacks — a record — landing while the Eurosystem’s holdings run off. The arithmetic implies substantial net absorption by private investors, whoever they turn out to be.
Two geographies
So who does hold the risk, and where? Plotting each euro-area sovereign by its spread over Bunds and the share of its debt securities held by non-residents produces a map that inverts the intuitive one.
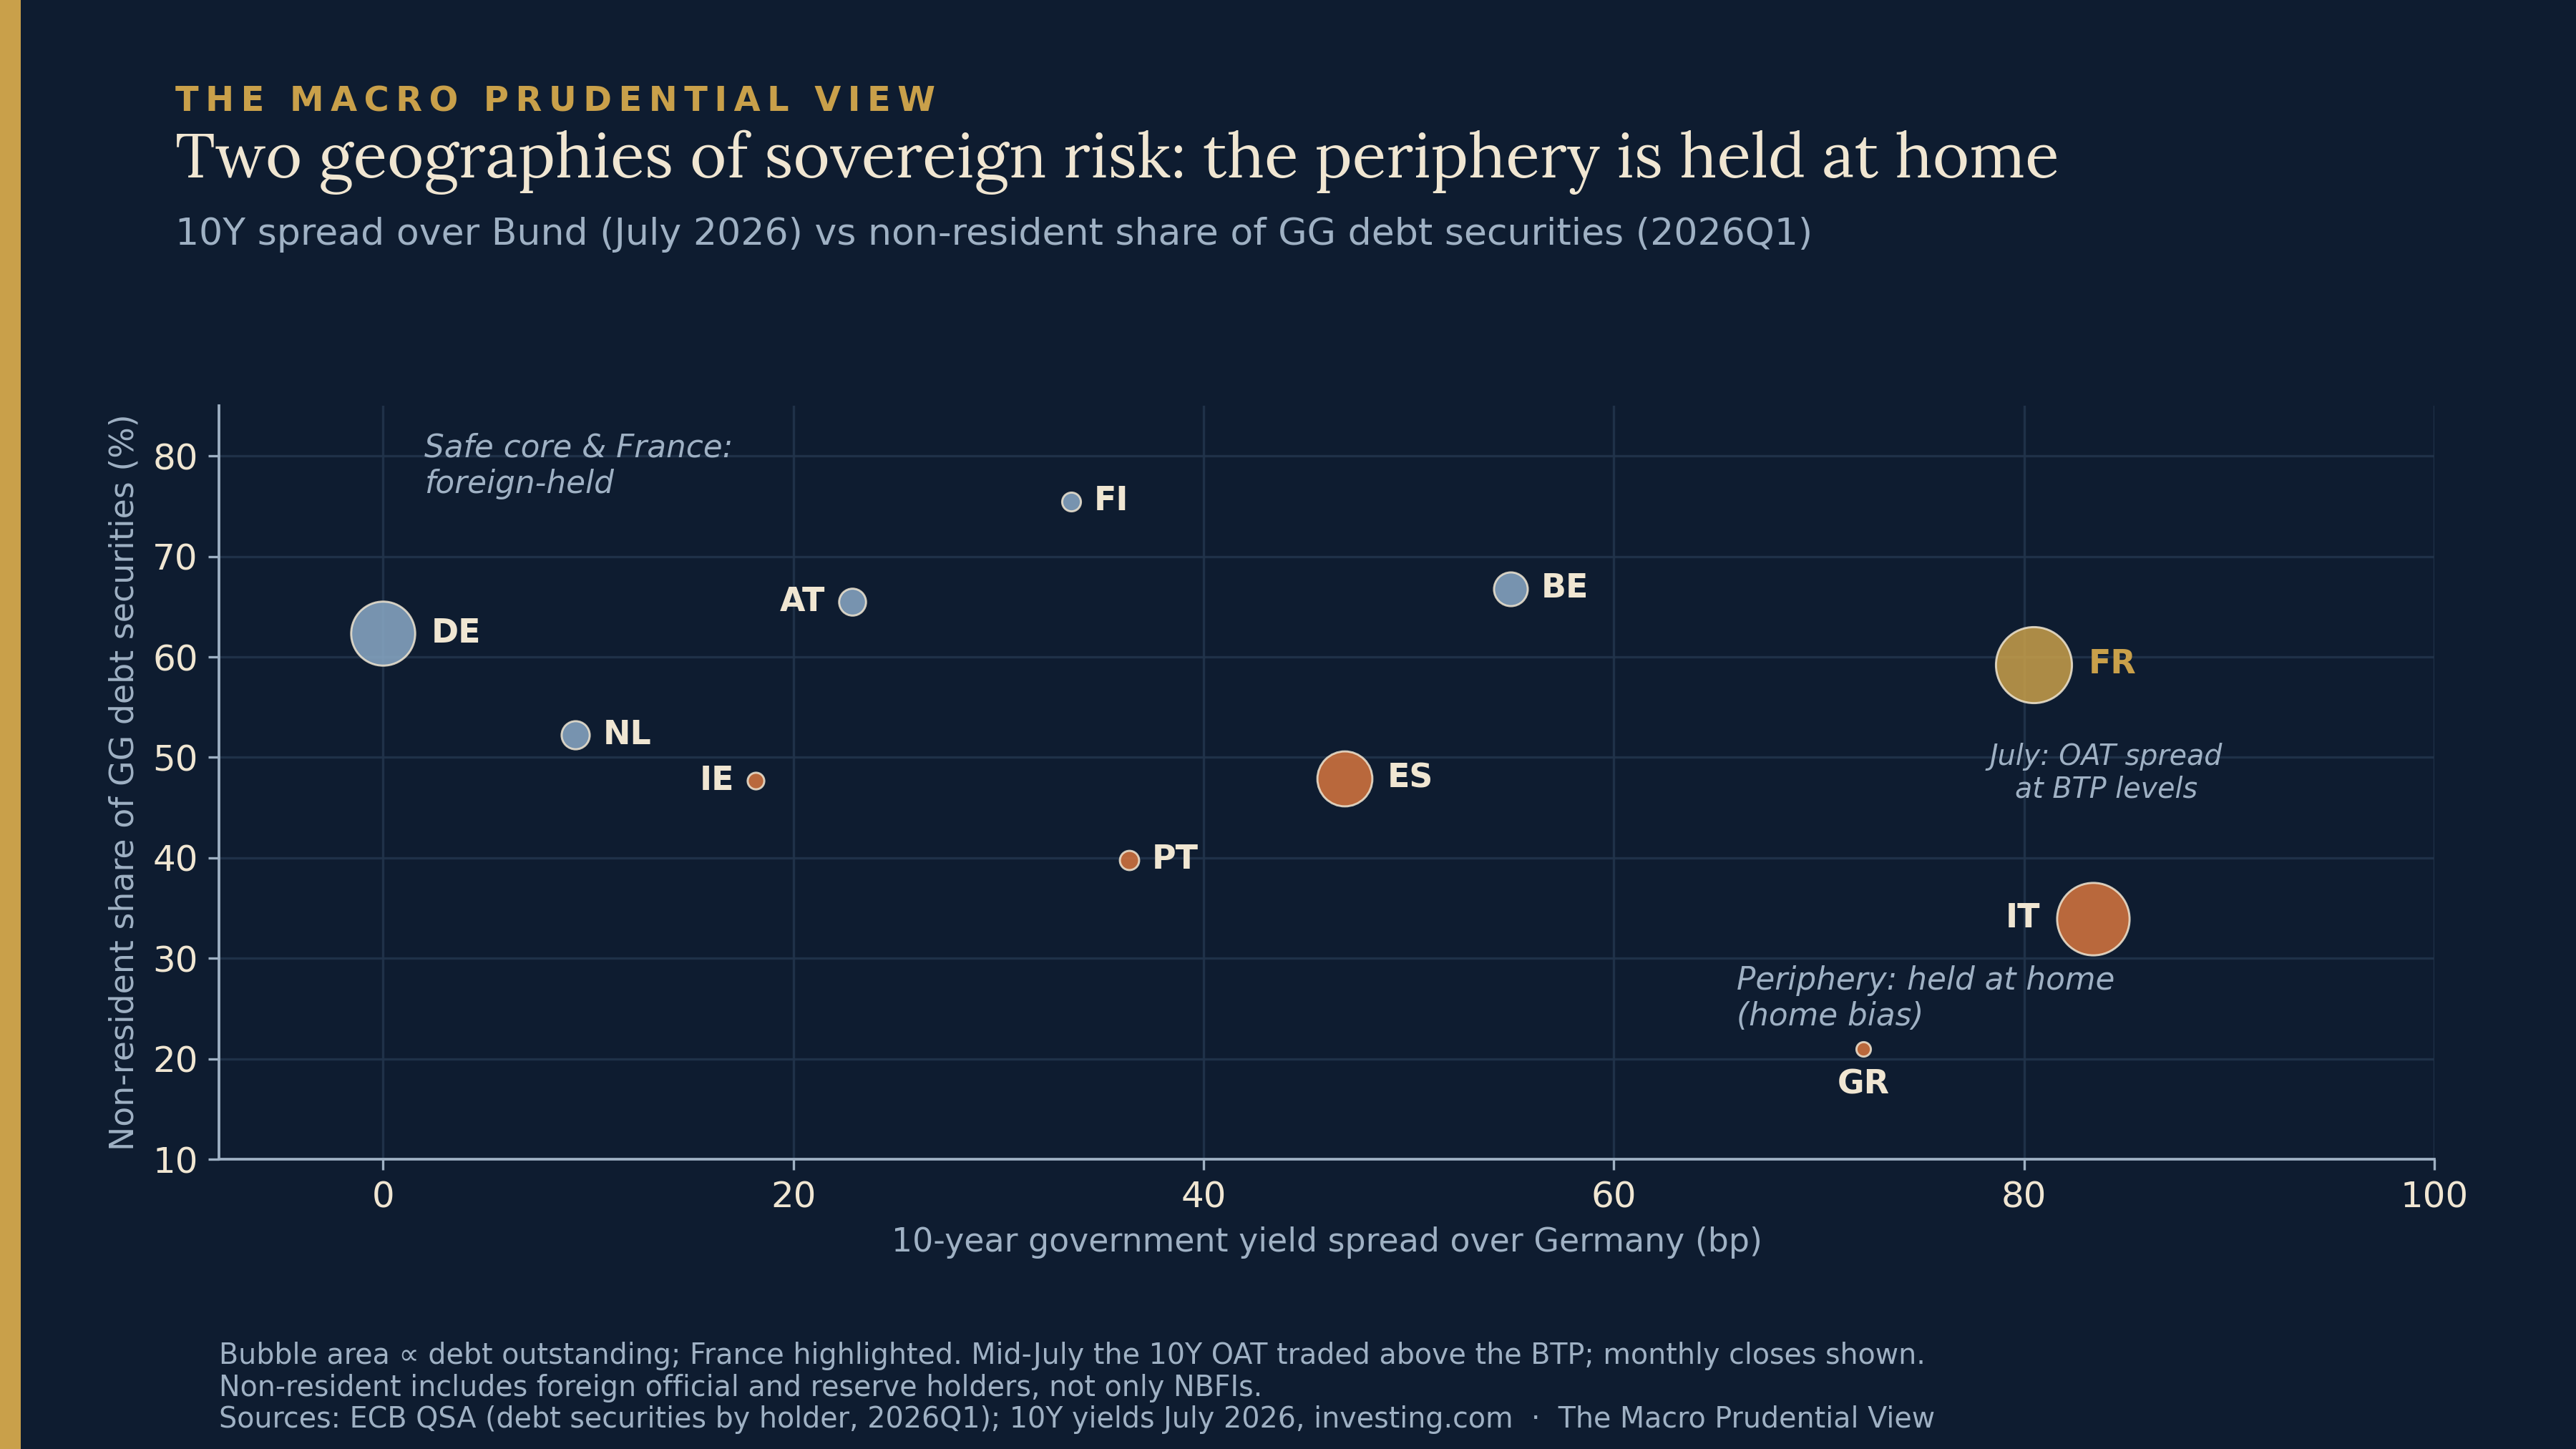
Foreign ownership tends to be high where risk is low. Germany’s debt is 62% foreign-held, Finland’s 76%, Austria’s 66%. At the other end sit the highest-spread sovereigns with the lowest non-resident shares in this sample: Italy at 34% foreign, Greece at 21%. The middle is genuinely mixed — Portugal at 40% and Spain at 48% do not fit a tidy home-held grouping — but the clustering is visible, and it is home bias: the configuration in which sovereign stress lands first on domestic bank balance sheets, which is exactly why the post-2011 apparatus watches it.
France does not fit either cluster. It is an Italian-sized market — nearly €3tn of government securities outstanding — that in July briefly traded at periphery-like spread levels, on a foreign-held base of about 59%. The comparison is about the coexistence of similar headline spread levels and sharply different holder geographies; it is not an assertion that French and Italian credit risk, market liquidity or institutional backstops are equivalent. The fiscal backdrop, in one sentence: a 5.1% deficit in 2025, debt at 115.6% of GDP and projected by the Commission to keep rising, and four rating actions since 2024, most recently Moody’s to Aa3.
The question France poses is the interesting one, and it is not really a question about France. What does repricing look like when a large issuer’s debt is held mainly by investors beyond the issuer country’s own holder map, across datasets that do not connect positions to financing, leverage or liquidity terms? Belgium, at 67% foreign-held and a 55 basis point spread, sits on the same line at smaller scale. The old configuration made a larger part of the bank–sovereign link visible in domestic balance-sheet data. For issuers such as France, the visible holder base is dispersed across jurisdictions and broad sectors, while the transmission chain remains only partly observable.
The observable linkage
If sovereign risk reaches banks through their non-bank counterparties, the pipe should show up on bank balance sheets. It does — and its most striking property is how little it moves.
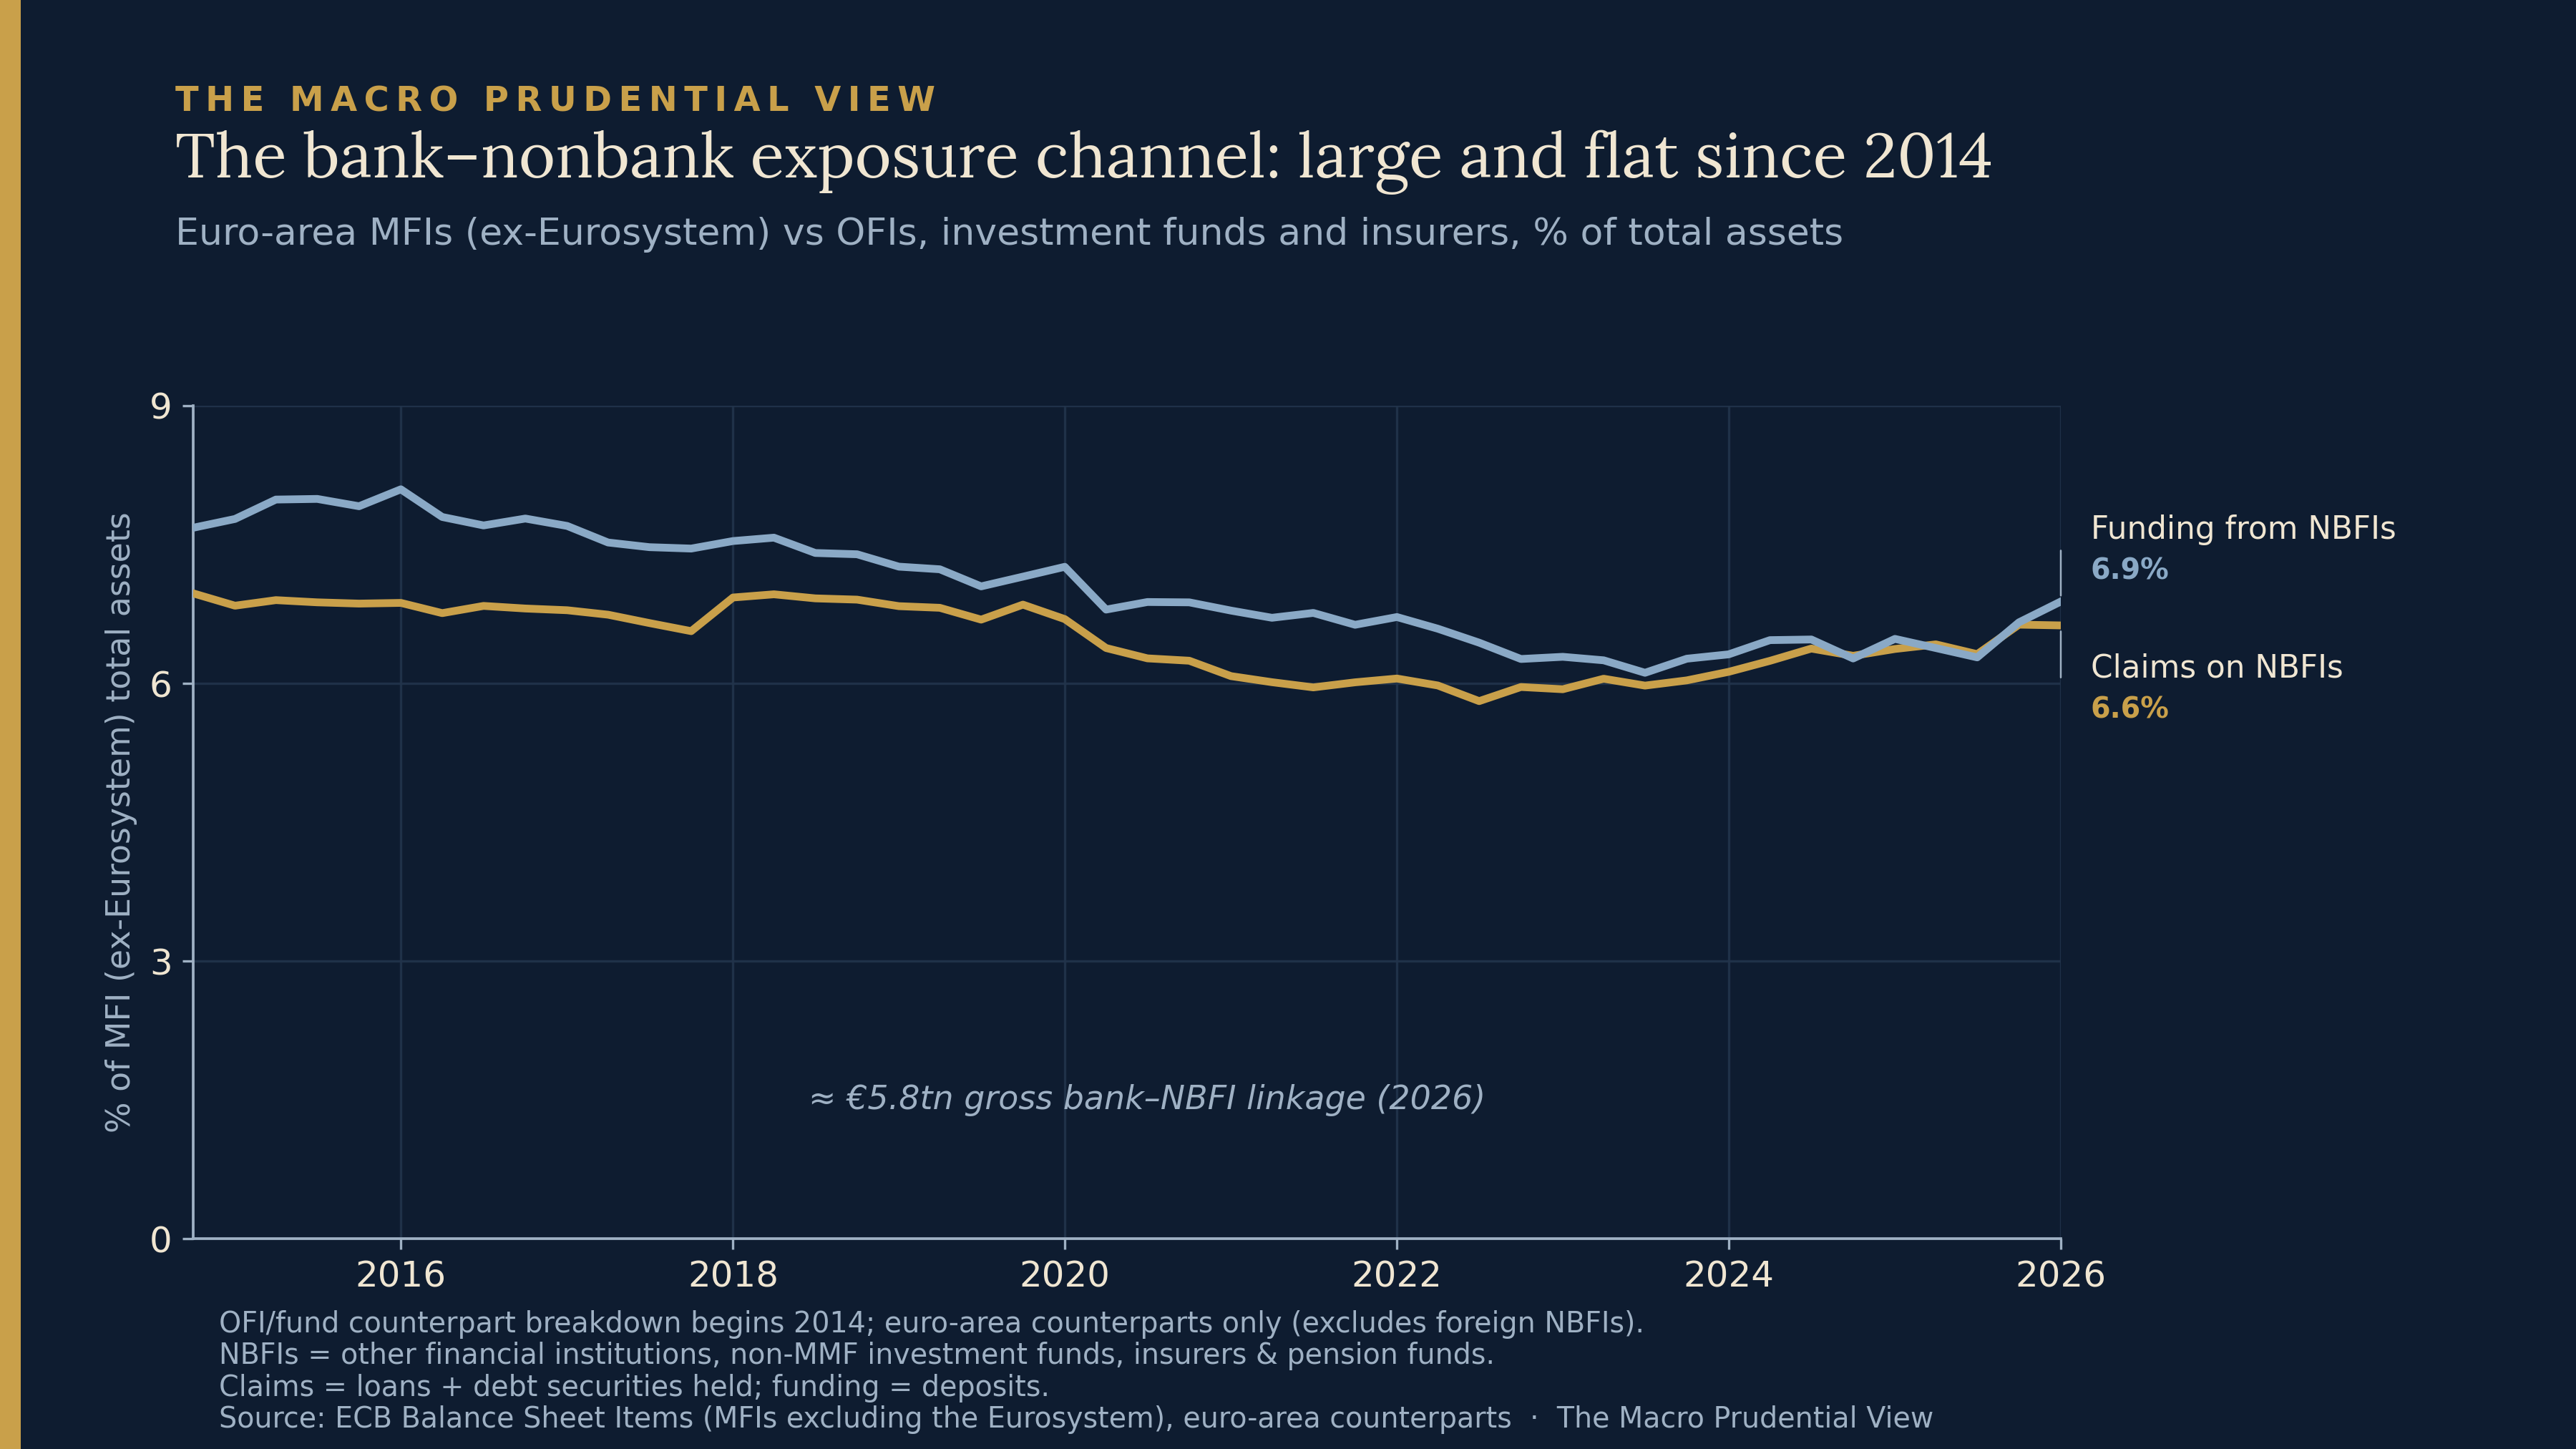
Euro-area banks’ claims on NBFIs — loans plus debt securities, with reverse repo inside the loans line — have run at 6–7% of total bank assets since the counterpart data begin in 2014, and stand at 6.6% now. Funding taken from NBFIs, mostly deposits, is slightly larger at 6.9%. Together the two directions sum to roughly €5.8tn. To be clear about the accounting: that is a gross sum of claims and funding, a measure of two-way balance-sheet linkage, not of net credit exposure or loss-absorbing capacity. The point it establishes is scale and permanence. This is standing infrastructure, not a boom.
A flat pipe and a changing risk association are not a contradiction, and it is worth saying why. The BIS result concerns what exposures transmit, not how large they are: co-movement conditional on a given exposure can strengthen while the exposure itself is unchanged — through the shift out of the zero-rate regime, through the volatility of the collateral moving across it, or through changes in who sits inside the aggregate and how levered they are. Whether the composition inside the pipe shifted is precisely what the aggregate cannot show. The euro-area statistics capture euro-area counterparts only; the counterparty, collateral and cross-border composition of the linkage is not published.
Direct evidence on the unobserved euro-area leg is limited, and what can be said is comparative rather than conclusive. Where the leveraged non-bank presence can be observed, it is rising: the BIS’s Annual Economic Report documents hedge funds’ US sovereign exposures more than doubling since 2022 and their share of euro-area electronic government-bond trading increasing markedly — a turnover measure, not a leverage one. The Bank of England’s July Financial Stability Report finds the leverage concentrated in “a small number of hedge funds pursuing similar trading strategies across jurisdictions”. The relevant mechanism is nevertheless not uniquely American: the ESRB’s EU Non-bank Financial Intermediation Risk Monitor identifies leverage, liquidity mismatch and interconnectedness as material vulnerabilities in EU non-bank intermediation. Whether, and how far, those vulnerabilities sit in the French sovereign-holder chain is precisely what published data cannot determine.
The FSB’s February report on government bond-backed repo markets supplies the mechanism in general form: repo is how non-banks lever sovereign positions, how that leverage depends on short-term funding, and how it interconnects with the dealer banks that provide it. Which returns us to the question the holder data leave open: who, concretely, is on the other side of France’s roughly $2.6tn of foreign-reported sovereign holdings?
Who the foreigners are
The honest answer comes in two layers, from two datasets that do not quite meet.
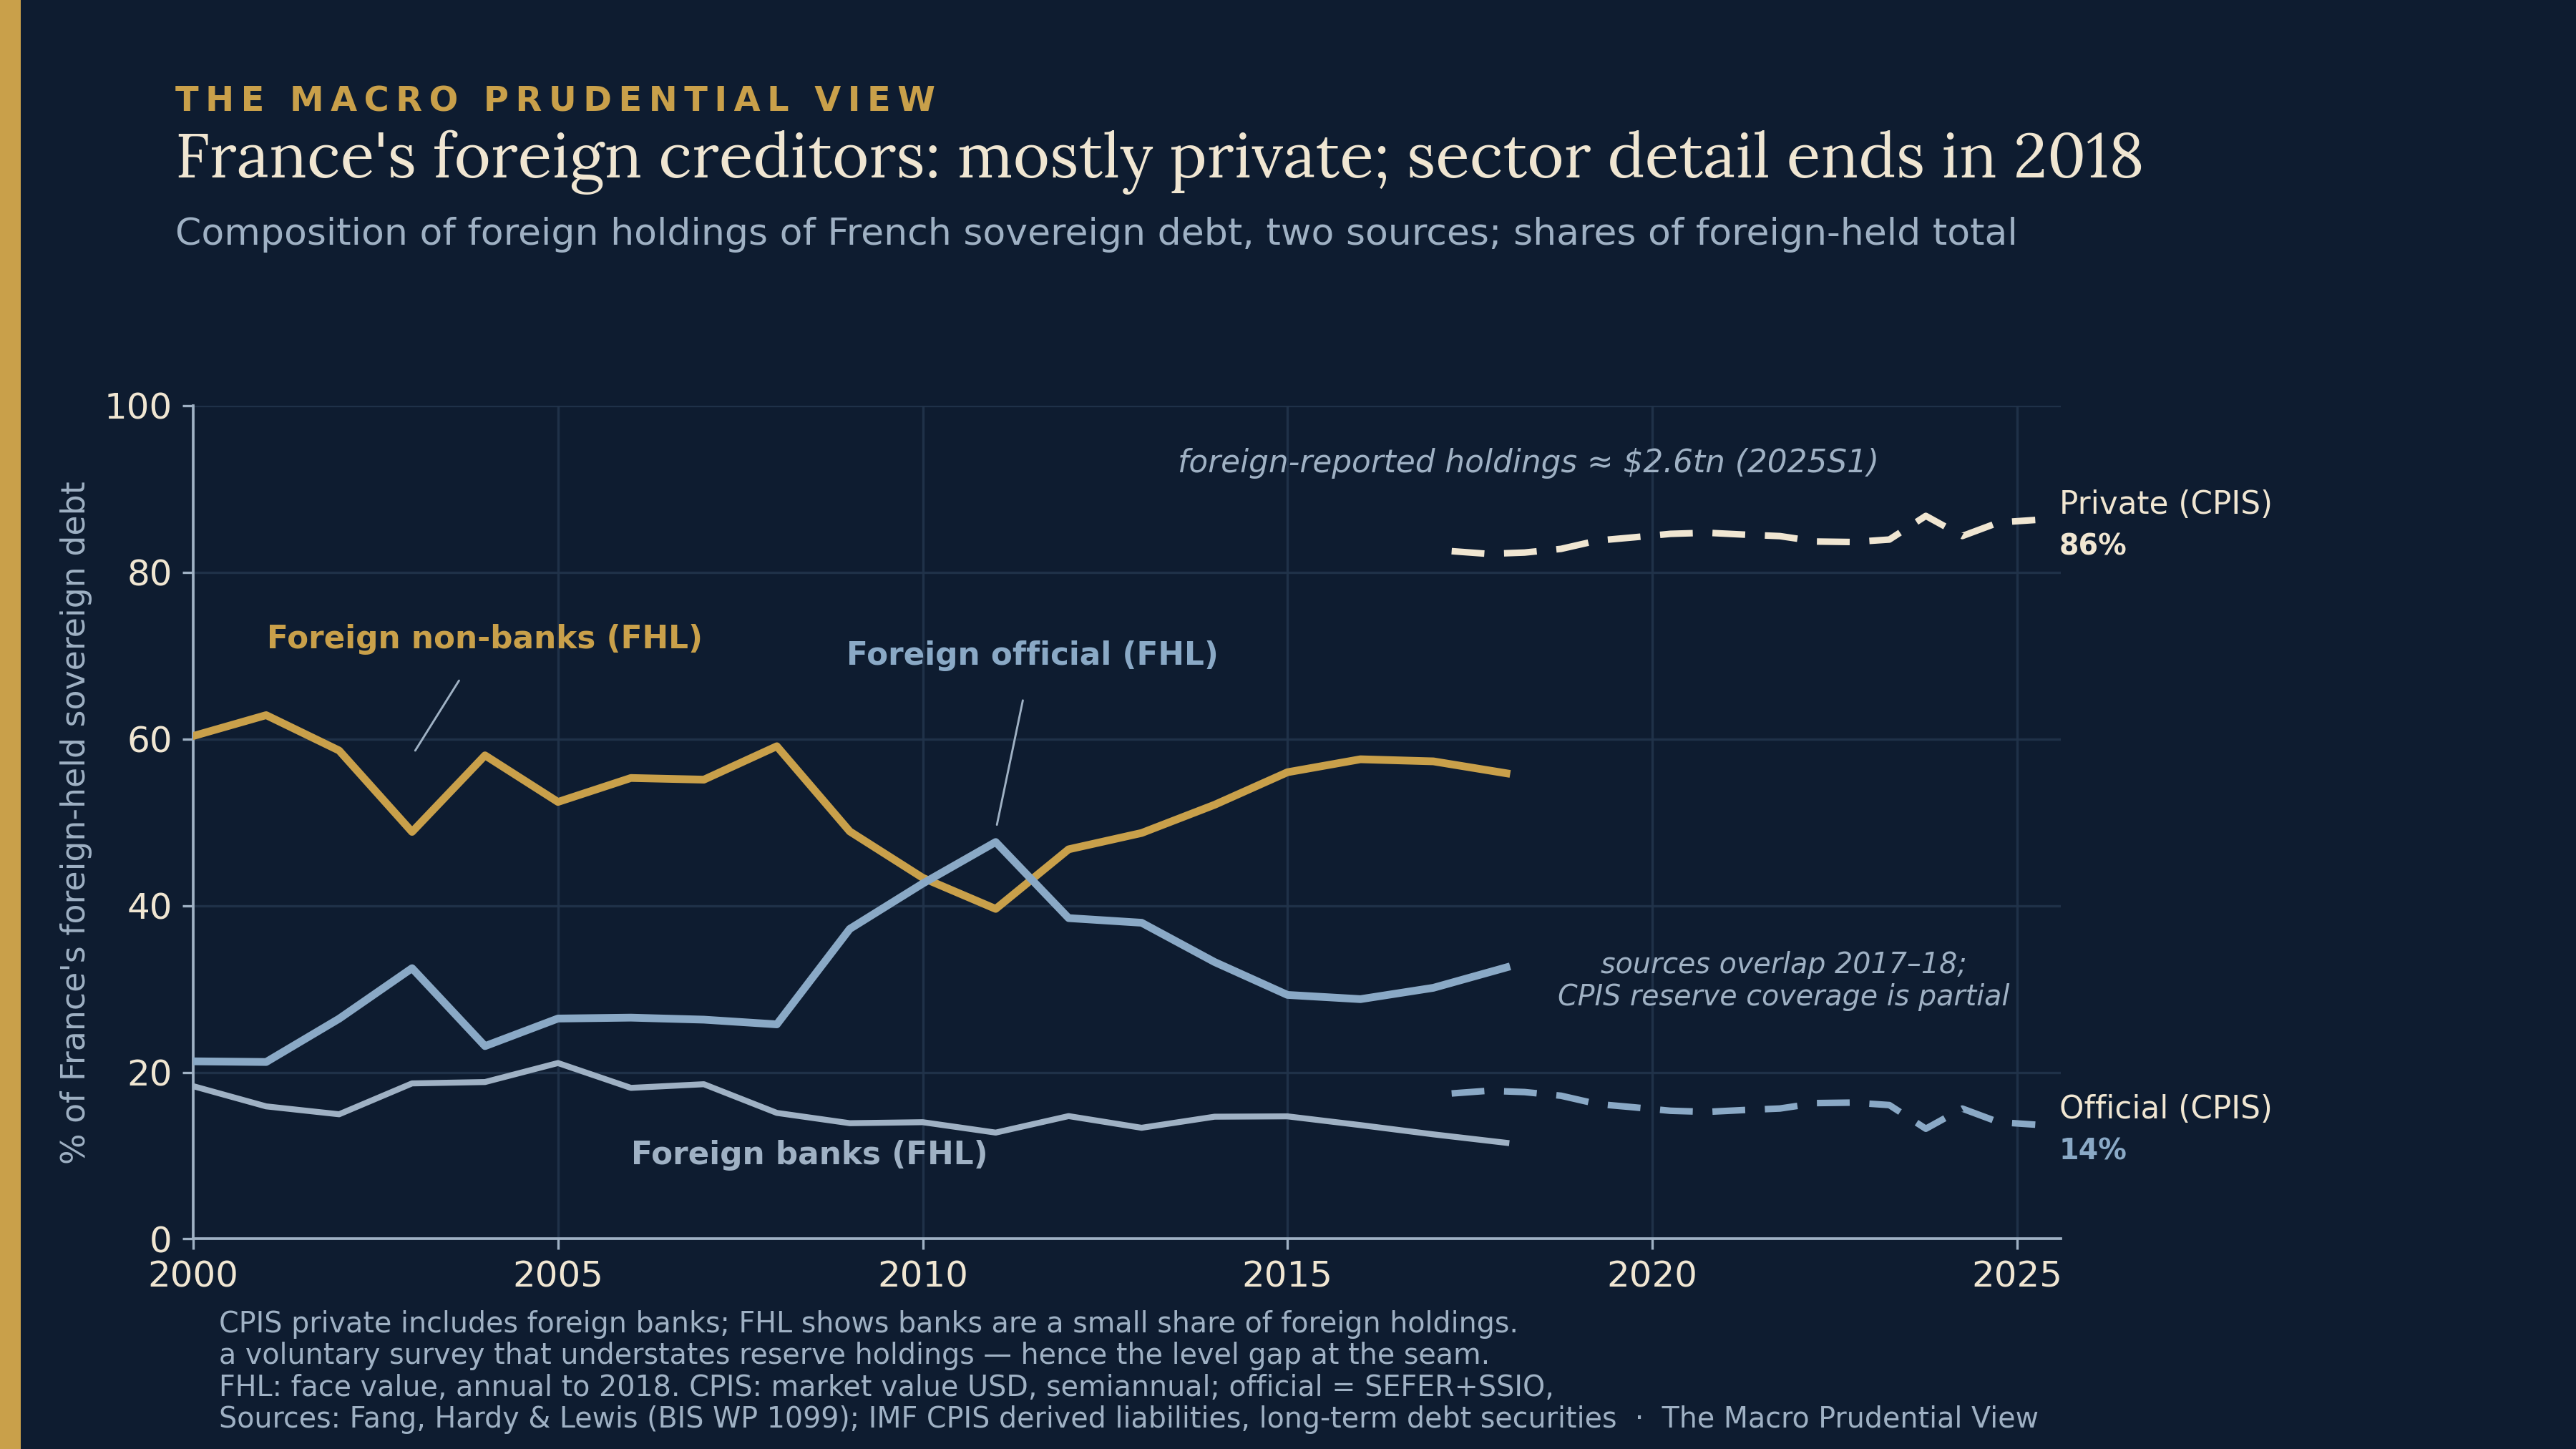
The first layer is historical and granular. The Fang–Hardy–Lewis dataset — built at the BIS, the successor to the Arslanalp–Tsuda investor-base series the nexus paper itself relies on — decomposes France’s foreign holders into official institutions, banks and private non-banks through 2018. In it, non-banks became the largest foreign holder class around 2012 and reached 56% of foreign holdings by 2015, roughly double the official share and five times the banks’; the published version in the Review of Financial Studies adds that within euro-area private non-banks, investment funds dominate, not insurers or pension funds. The second layer is current but coarser. The IMF’s CPIS lets us split France’s foreign-reported holdings — about $2.6tn at mid-2025 — into official reserve holdings and everything else; “private” here means simply non-official, and includes foreign banks. The official share is around 14% and falling; the private share has risen from 82% to 86% since 2017. The creditor geography offers one further cut, to be read with its limitation first: about a fifth of foreign-reported holdings is reported from Luxembourg and Ireland. That is consistent with the importance of fund domicile and custody chains, but CPIS cannot identify the ultimate investor or establish a fund-sector share. The data establish, in order: that banks stepped back; that domestic non-banks did not replace them; that France’s foreign base is overwhelmingly private rather than official, with classification caveats; that within private, non-banks were the dominant class as far as the sector detail runs, which is 2018. What remains a hypothesis is the final step — that this foreign non-bank money is the channel through which the next episode of sovereign stress transmits.¹
The 2018 break is substantive. Current publications confirm that non-bank intermediation matters in sovereign markets, but they do not restore a current France-specific breakdown of foreign creditors into banks, funds, insurers and other private investors. And the breakdown is what stress analysis would need: an insurer, an index fund, a levered relative-value fund and a foreign bank treasury hold the same bond with entirely different redemption structures, leverage, repo dependence, hedging behaviour and dealer relationships. Knowing that the foreign base is “private” tells an authority almost nothing about how it behaves when spreads gap.
The composition still matters for a further reason. In the Fang–Hardy–Lewis sample, private non-banks absorb a disproportionate share of increases in sovereign debt — roughly 70% — and the strongest yield-responsiveness result concerns emerging-market sovereigns, with elasticities much lower across investor groups in advanced economies. That does not identify the current marginal buyer of French debt, nor does it establish a French stress-elasticity. It does show why the distinction between official, bank and non-bank foreign demand is not merely descriptive — and why losing the sector detail after 2018 is consequential.
The toolkit and the join problem
The first geography is comparatively legible in existing sovereign-exposure, bank-disclosure and home-bias metrics — the instruments exist because the euro area crisis taught us where to point them. The cross-border chain is only partly observable as a connected system, and not for want of attention; the FSB built a task force for it. The specific gap is this: no authority holds an integrated, instrument-level map linking sovereign holders, their leverage and liquidity terms, and the bank counterparties that finance them across borders. The ECB’s securities statistics do not sectorise non-resident holders. AIFMD reaches EU-domiciled funds but does not join their reporting to holdings data. The marginal holder of French debt may file with the SEC, the FCA, or no one — and the datasets that each capture one link in the chain do not connect.
The holder geography and the public backstop are assessed through different institutional frameworks: one concerns the structure of private intermediation, the other a separate monetary-policy assessment. The public data do not connect the two.
On policy, restraint is warranted, starting with what the paper does and does not do. It does not calibrate instruments or identify a uniquely European response; it changes the object that any such response must be able to observe. It strengthens the case for treating sovereign-market intermediation as a bank–NBFI resilience issue rather than solely a bank-sovereign concentration problem. The ESRB has already located part of the live policy debate in exactly these markets: in its response to the Commission’s consultation on macroprudential policy for non-bank financial intermediation, it wrote that the Commission “should consider introducing margin requirements in bilaterally cleared government bond cash and repo transactions and ways to facilitate the central clearing of such transactions”. The relevance here is not that the BIS paper proves those instruments right; it is that the paper changes the intermediation chain such instruments would need to address — and, one might add, that minimum haircuts, central clearing and NBFI leverage limits are also the closing policy list of the paper itself. Its final sentence, though, belongs to the fiscal side: none of this substitutes for sustainable fiscal trajectories.
The unfinished map
What this piece has traced is not a second geography fully mapped, but the boundary at which the published map breaks: cross-border holders, financing relationships and collateral chains that existing datasets do not join. The coastline is measured — a large foreign-reported stock of French debt, mostly private; a large, persistent balance-sheet linkage between euro-area banks and NBFIs. The interior — who within it is levered, against what collateral, financed by which dealer, subject to which liquidity terms — is unmapped at the instrument level: a join problem, not an absolute absence. Aggregate holder shares and aggregate bank–NBFI links cannot identify the transmission chain an authority would need to see during a sovereign-market stress event.
Three things to watch. The FSB task force’s report, whenever it lands, will show how much of the interior the official sector believes it can map. The French budget round this autumn will be a key event for whether July’s repricing persists. And the arithmetic of quantitative tightening against record issuance will keep making the identity, financing and liquidity terms of the marginal buyer more important — and still only partly observable. Mapping that chain is the unfinished task.
¹ A note on definitions. Holder residence follows the issuer’s perspective: “foreign” means non-resident of the issuing country, which includes other EU domiciles — a Luxembourg fund is foreign to France and inside the EU’s regulatory perimeter. “Official” in Fang–Hardy–Lewis is estimated from reserve-allocation data; in CPIS it is the voluntary SEFER survey, which undercounts reserve managers — hence the level gap where the two series overlap. CPIS “private” is everything non-official, including foreign banks; the bank/non-bank split exists only in Fang–Hardy–Lewis, to 2018. CPIS records holdings by the economy of the reporting holder, so custody and fund domicile shape the geography. Fang–Hardy–Lewis is face value, annual; CPIS is market value in dollars, semiannual.
Paweł Fiedor - The Macro Prudential View
Positions described are as at 7 August 2026.
The author works at the Central Bank of Ireland and in the ESRB Secretariat. This piece is written in a personal capacity; views are the author’s own and should not be attributed to the Central Bank of Ireland, the ESRB, or the Eurosystem. It draws exclusively on publicly available sources and takes no position on whether the policy measures discussed should be adopted.
Sources: Avdjiev, Hardy and Jager, “The evolving nexus: sovereigns, banks and NBFIs”, BIS Working Papers No 1369, July 2026 — https://www.bis.org/publ/work1369.htm; Fang, Hardy and Lewis, “Who holds sovereign debt and why it matters”, BIS Working Papers No 1099 (2023) and Review of Financial Studies 38(8) (2025), with the accompanying dataset — https://www.bis.org/publ/work1099.htm; Arslanalp and Tsuda, “Tracking global demand for advanced economy sovereign debt”, IMF Economic Review 62 (2014); FSB, “Vulnerabilities in Government Bond-backed Repo Markets”, 4 February 2026, and “FSB Workplan to Address Nonbank Data Challenges”, July 2025 — https://www.fsb.org; Bank of England, Financial Stability Report and FPC Record, July 2026 — https://www.bankofengland.co.uk; BIS, Annual Economic Report 2026, Chapter II — https://www.bis.org; ESRB, response to the European Commission targeted consultation on macroprudential policies for non-bank financial intermediation (”A system-wide approach to macroprudential policy”, November 2024), and EU Non-bank Financial Intermediation Risk Monitor — https://www.esrb.europa.eu; ECB Quarterly Sector Accounts and Balance Sheet Items statistics, ECB Data Portal — https://data.ecb.europa.eu; IMF Coordinated Portfolio Investment Survey — https://data.imf.org; Agence France Trésor, indicative State financing programme for 2026, 30 December 2025 — https://www.aft.gouv.fr; INSEE, national accounts first estimate, March 2026; European Commission, Spring 2026 Economic Forecast (France); ten-year government bond yields via investing.com. Chart data as cited in each figure.