


Every year the Cayman Islands Monetary Authority publishes an Investments Statistical Digest, and every edition since 2015 has carried a table called “Portfolio Investments by Jurisdiction”: the long and the short positions of the funds CIMA regulates, by country of the issuer of the securities, split into equities, short-term debt and long-term debt. The same fund return is the main feed of the Cayman Islands’ submission to the IMF’s Coordinated Portfolio Investment Survey, which the IMF publishes with a separate indicator for short positions by counterpart economy. Read the two side by side and you have a Cayman-labelled, country-of-issuer record of a large cash short in German long-term debt (debt by country of issuer, which is not a sovereign identifier), public for a decade: US$103bn in 2016, 141bn in 2018, 175bn in 2021 in the digest; 186bn for 2022 in the IMF series. Among the country shorts the tables print, Germany was first in seven of the nine years to 2023, and between 82% and 96% of the German short in every year was long-term debt. CIMA said so itself, in three editions running.
Then the ECB, in May 2024, described from confidential EMIR and SFTR data the offshore funds behind the euro-area basis trade, “mostly domiciled in the Cayman Islands”, which had “mostly taken long futures positions at the same time as borrowing underlying bonds in the repo market and presumably short selling them”. The ESRB’s SFTR series then showed Cayman-based entities move from net repo lenders against about €100bn of EU sovereign collateral in 2023 to net borrowers averaging €115bn in the last quarter of 2024. The public record for the 2023 and 2024 columns is this: the German long-term debt book of the Cayman reporter was net short by US$65–67bn for 2023 and net long by US$32–33bn for 2024, in the digest and in the IMF series alike. It is the first positive net since 2015, when both printed about +7bn, after eight consecutive years net short. The two compilations disagree about the gross legs for 2024 (the IMF has the short at 22bn and the long at 55bn, the digest 81bn and 113bn) by nearly matched amounts, and agree about the net to within a few per cent. Two cautions belong in the same breath. The digest’s columns are aggregates of positions at each fund’s own year-end, so its 2024 column spans dates on both sides of that third-quarter swing; the IMF’s carry a 31 December reference date, and whether Cayman fills them from the same year-end returns or from December positions is not published. And the two 2024 columns are not comparable with each other in the way the nine earlier pairs were, the tables say why only in part, and the population behind them shrank between the two columns.
What Cayman publishes
Every CIMA-regulated fund files a Fund Annual Return within six months of its own financial year-end. Section 12 of the return, “Allocation of Equity & Debt Securities and Master Funds by Country of Issuer”, asks for equity, long-term debt, short-term debt and master-fund holdings by country of issuer “where the total investments in each such country represent 10% or more of the net asset value of the fund”, and instructs that “short and long positions should be presented separately as positive and negative values within separate lines”. Derivatives go on other lines. The 2015 digest says why the section exists: “in order to include this information in the International Monetary Fund Coordinated Portfolio Investment Survey (CPIS) and to enhance data collection so as to improve the Authority’s supervisory framework”. The 2019 edition adds that “on a bi-annual basis, CIMA reports the jurisdiction of the issuer of securities held by funds, insurance, and banks to the International Monetary Fund in the form of a Coordinated Portfolio Investment Survey”.
So there are two compilations, with the fund return as the dominant feed of both. The digest’s table runs 2015 to 2024, as PDFs to 2019 and as Infogram embeds after (the 2023 edition is live on Infogram but no longer linked from CIMA’s archive page). The IMF’s Portfolio Investment Positions dataset carries the Cayman Islands as reporter, with long positions and, as a separate indicator, “short or negative positions”, by counterpart economy, annually from 2015; it has Italy where the digest folds it into “Other Developed Countries”. The CPIS is economy-wide, so I call the IMF series the Cayman reporter. What ties it to the fund return, beyond CIMA’s own description: where the IMF splits long positions by holder sector, other financial corporations hold 98–99% of Cayman’s German long-term longs in every year (54.4 of 55.1bn in 2024; deposit-takers 0.7bn; insurers 0.1bn); the short indicator is published for the total economy only, and the long indicator is gross of it (the IMF’s 2023 German long is 82.7bn against the digest’s gross 81.7bn; a holdings figure net of the 109bn short would be negative); and the fund-only digest and the total-economy IMF series agree on total shorts to within 1% in six of the nine years to 2023 and within 9% in all: 80 and 79bn in 2015, then 380/350, 312/310, 508/503, 336/336, 460/458, 645/589, 555/579 and 529/526. That the two can be read as the same funds’ positions is an empirical result, then, and it is the reason the IMF series is used at all. The second compilation adds access and a counterpart. It adds no independent evidence, and nothing below treats it as if it did.
Two things about the object before any figure. No fund count is published for any country row, in either compilation, so US$141bn of German shorts in 2018 is consistent with a few large books and with a crowd; and the threshold does not bound it, because the guide’s test is on “the total investments in each such country” rather than on each instrument, so a fund can qualify on its longs and contribute a small short. Concentration is unidentified. And the digest’s positions are as at each fund’s own financial year-end (it describes its population as submissions “with a financial year-end within the calendar year”), so I call its figures reporting-year aggregates and do not align them to a December date. The CPIS reference date is 31 December, and CIMA’s own submission instructions say so; whether the fund figures in it are those year-end returns carried in unchanged or December positions is not published, and I have asked (the nine years of agreement with the mixed-year-end digest are consistent with either). Coverage, with its vintages: 8,935 FAR submissions in 2015, 82% of regulated funds, when the regime covered mutual funds only; 25,080 and 22,894 in the 2023 and 2024 columns of the 2024 digest, after private funds came into the regime, of which mutual funds 10,775 and 7,762. The same edition’s text gives an “83.18% Fund Annual Return (FAR) submission rate, comparable to the previous year”; 22,894 of 30,150 regulated funds is 75.9%, so the table and the rate are on different bases, and I have asked which. The IMF’s technical assistance mission put CPIS coverage at about 8,000 funds at the end of 2022 and about 20,000 at the end of 2023.
What it shows, 2015–2023
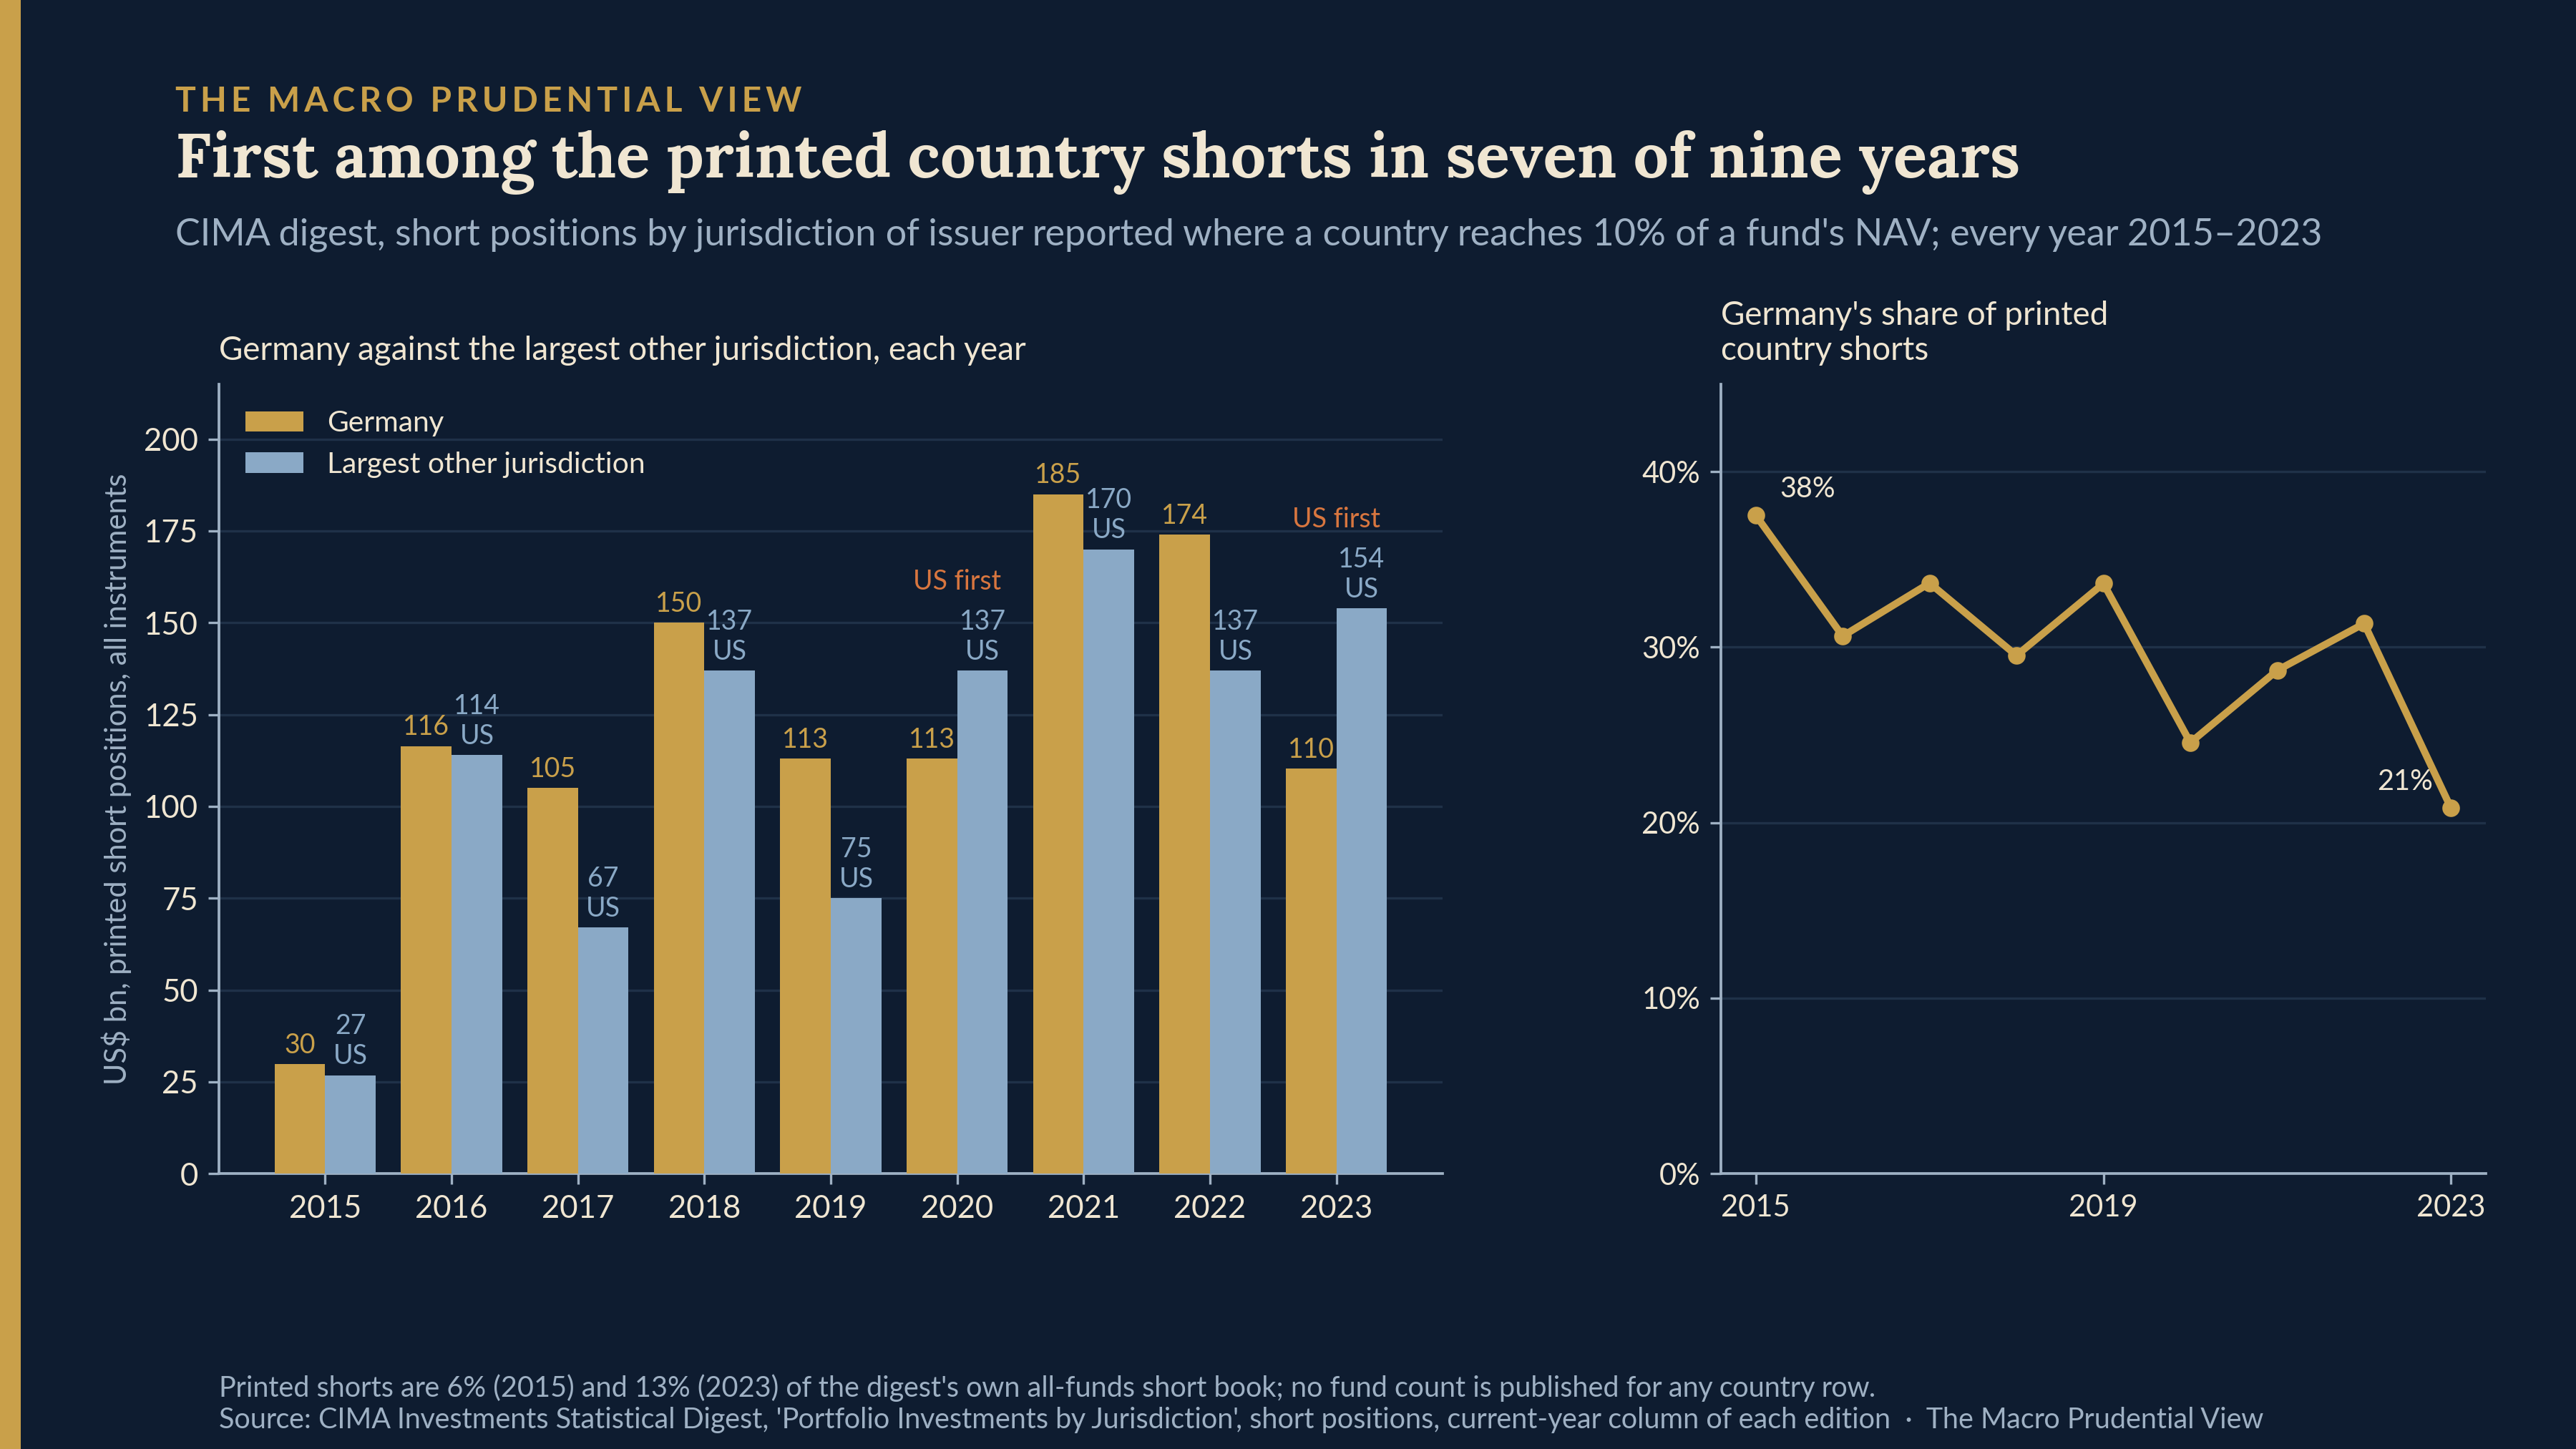
Every share and ranking here is of printed, above-threshold country shorts: the positions the return produces, which are a slice of Cayman funds’ short book. The digest’s asset-allocation section puts all funds’ short bonds plus short equities at US$1,306bn in 2015, 4,114bn in 2023 and 5,213bn in 2024; the jurisdiction table’s shorts were 6%, 13% and 46% of that. What the table shows is where the concentrated country shorts were.
Germany first by printed total shorts in 2015, 2016, 2017, 2018, 2019, 2021 and 2022; second to the United States in 2020 (137bn against 113) and 2023 (154 against 110). The IMF series, which separates Italy where the digest folds it into “Other Developed Countries”, gives the same seven years and the same two exceptions; Italy peaks at 57bn in 2022 and the digest’s whole “Other Developed Countries” row at 76, against Germany’s 174. CIMA’s words: “As in the prior year, the majority of the short position securities were issued in Germany” (2017 and 2018 editions); “Germany still accounted for the jurisdiction with most securities sold short” (2019). Germany’s share of the printed country shorts falls from 38% in 2015 to 21% in 2023 while the level rises to its 2021 peak, because US and Japanese shorts grew faster. The ranking, year by year, and the share are in the first chart.
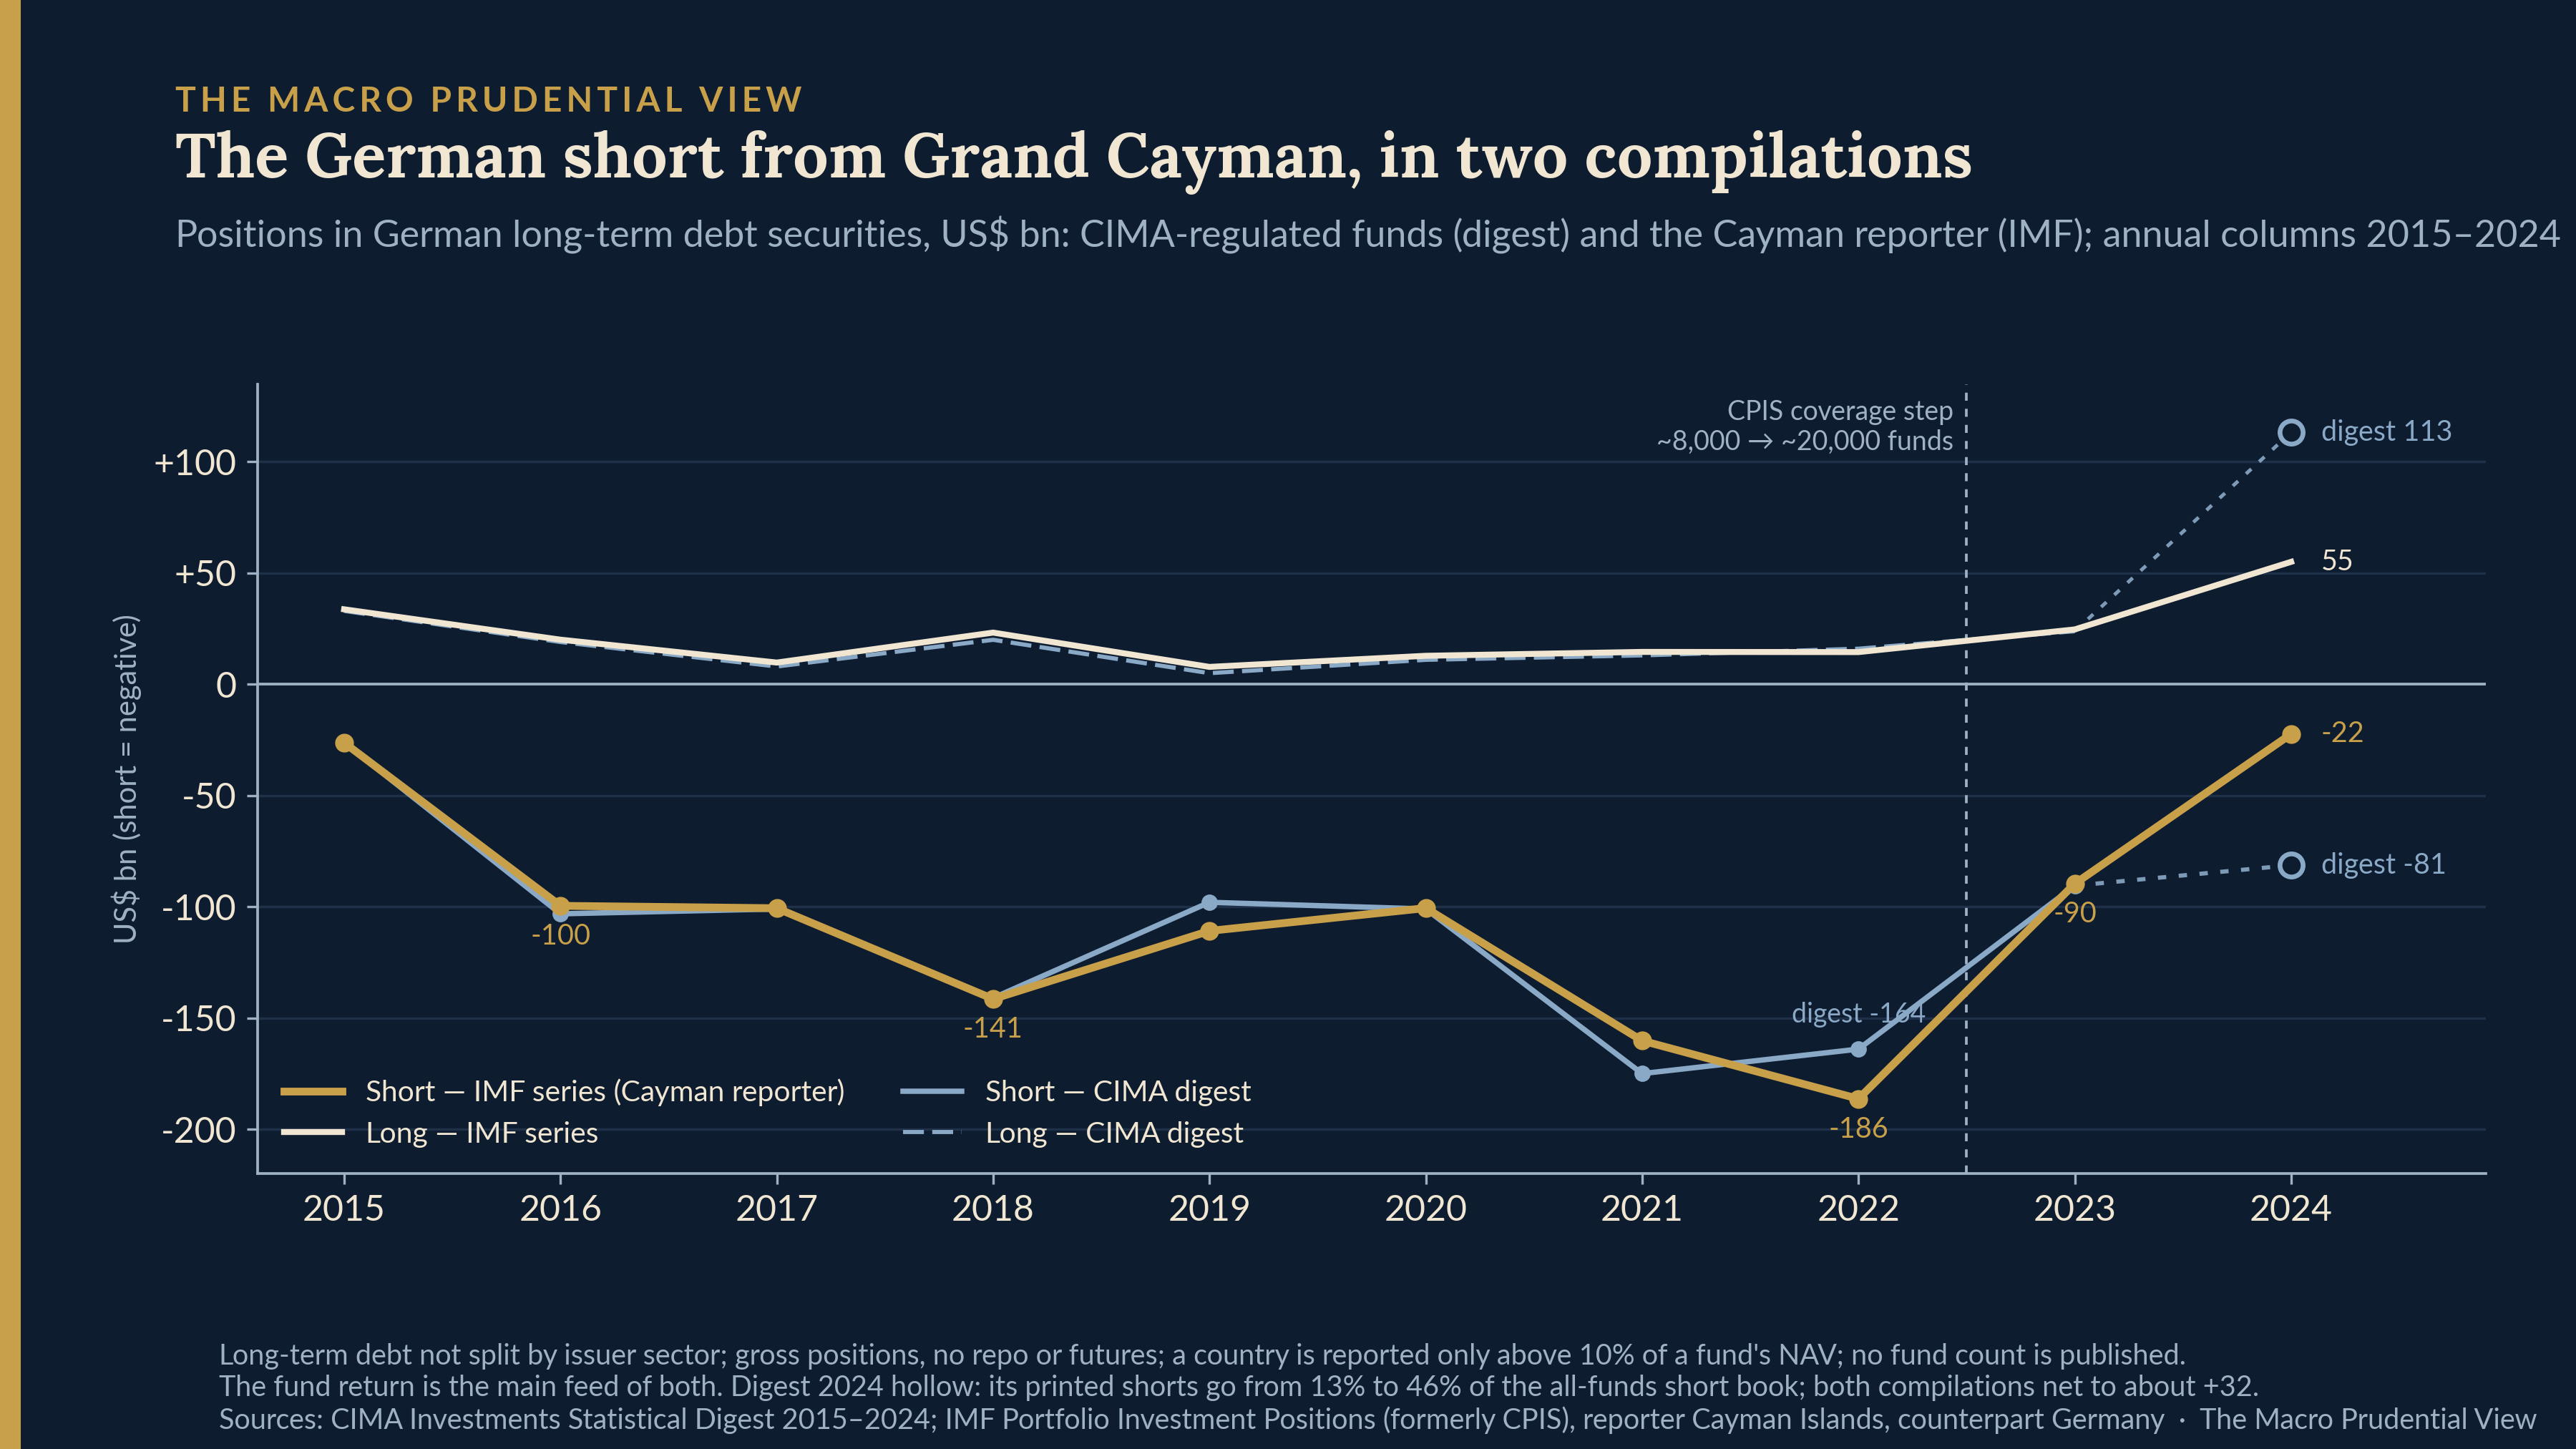
The German long-term debt short itself, in the two compilations, is the second chart. The two series lie on top of each other for most of the decade; the German cell is 13% apart in 2019, 8.5% in 2021 and 14% in 2022 (the same return at different vintages and allocations), so wherever they differ I name the series and print the other, and the peak is 175bn in 2021 in the digest or 186bn for 2022 in the IMF series. Long-term debt is 88 to 96% of the German short in every year to 2022, 82% in 2023 and 73% in the 2024 column. France’s long-term short runs beside it, from 2bn in 2015 to a peak of 81bn in 2021 and 41bn in 2023.
The short side is the one to lean on, and the reason is in the editions themselves: each edition reprints the prior year, and the total short was restated by less than 1% in eight of the nine overlaps and by 4% in the ninth (2021, in the edition that expanded coverage), the German short by 0.5% or less in every one, while the long side was restated by coverage — the 2022 edition added private and limited-investor funds and lifted 2021 longs from US$4.4tn to 7.2tn with shorts moving only from 645 to 671bn. That is consistent with the concentrated shorts having sat in funds that were in the perimeter all along; it does not establish a constant population of short sellers, and nothing here rests on one.
The confidential picture, and where the public one meets it
The ECB’s box in the May 2024 Financial Stability Review is the description everyone in this market works from: “These funds are mostly domiciled in the Cayman Islands”; they account “for almost the entire euro area government bond repo activity of non-EU investment funds”; their repo positions had been “growing up to threefold since the beginning of 2021”. The ESRB’s 2025 NBFI Risk Monitor then put a series on it, “Net outstanding repo borrowing by KY entities with EEA government bonds as collateral”, for “market participants based in the Cayman Islands, some of which pursue hedge fund strategies”: “In 2023 these entities were net repo lenders, receiving as collateral EU sovereign bonds amounting to approximately €100 billion ... In the third quarter of 2024 Cayman-based entities became net repo borrowers, with balances rising to an average of €115 billion in the fourth quarter of 2024.” The Banca d’Italia’s April 2026 Financial Stability Report says the same of the Italian leg: “Since mid-2024, the net debtor position of these funds in repos that use Italian government securities as collateral has turned positive, indicating that these instruments are used for funding purposes.”
That is the mechanism the confidential data show. What the public tables show is bonds sold short by country of issuer and, for 2024, a printed net that changed sign. The official findings are the reason to look at the public record; they do not validate it, and the public series does not match them: the printed German short was already US$103bn in 2016 and 141bn in 2018, before the repo growth the ECB dates from the beginning of 2021, and the table cannot tell an unhedged short from the cash-short, futures-long book the ECB describes. The populations differ by construction (CIMA-regulated funds filing a return; SFTR counterparties based in the Cayman Islands), the objects differ (annual securities positions; quarterly repo nets), and the public series cannot place anything inside a year, so nothing here dates the printed net against the ESRB’s third-quarter swing. Neither the ECB’s box nor the 2025 Monitor cites CIMA, the digest or the CPIS; I record that as a fact about two documents and infer nothing from it.
The turn, on the net, and the two readings of the gross
Two comparisons, kept apart. 2022 to 2023 crosses the CPIS coverage step, about 8,000 funds to about 20,000; the reported German long-term short fell from 186 to 90bn in the IMF series while the reported population rose two and a half times; what continuing funds did across that step is not identified, in either direction. 2023 to 2024 is the comparison I make.
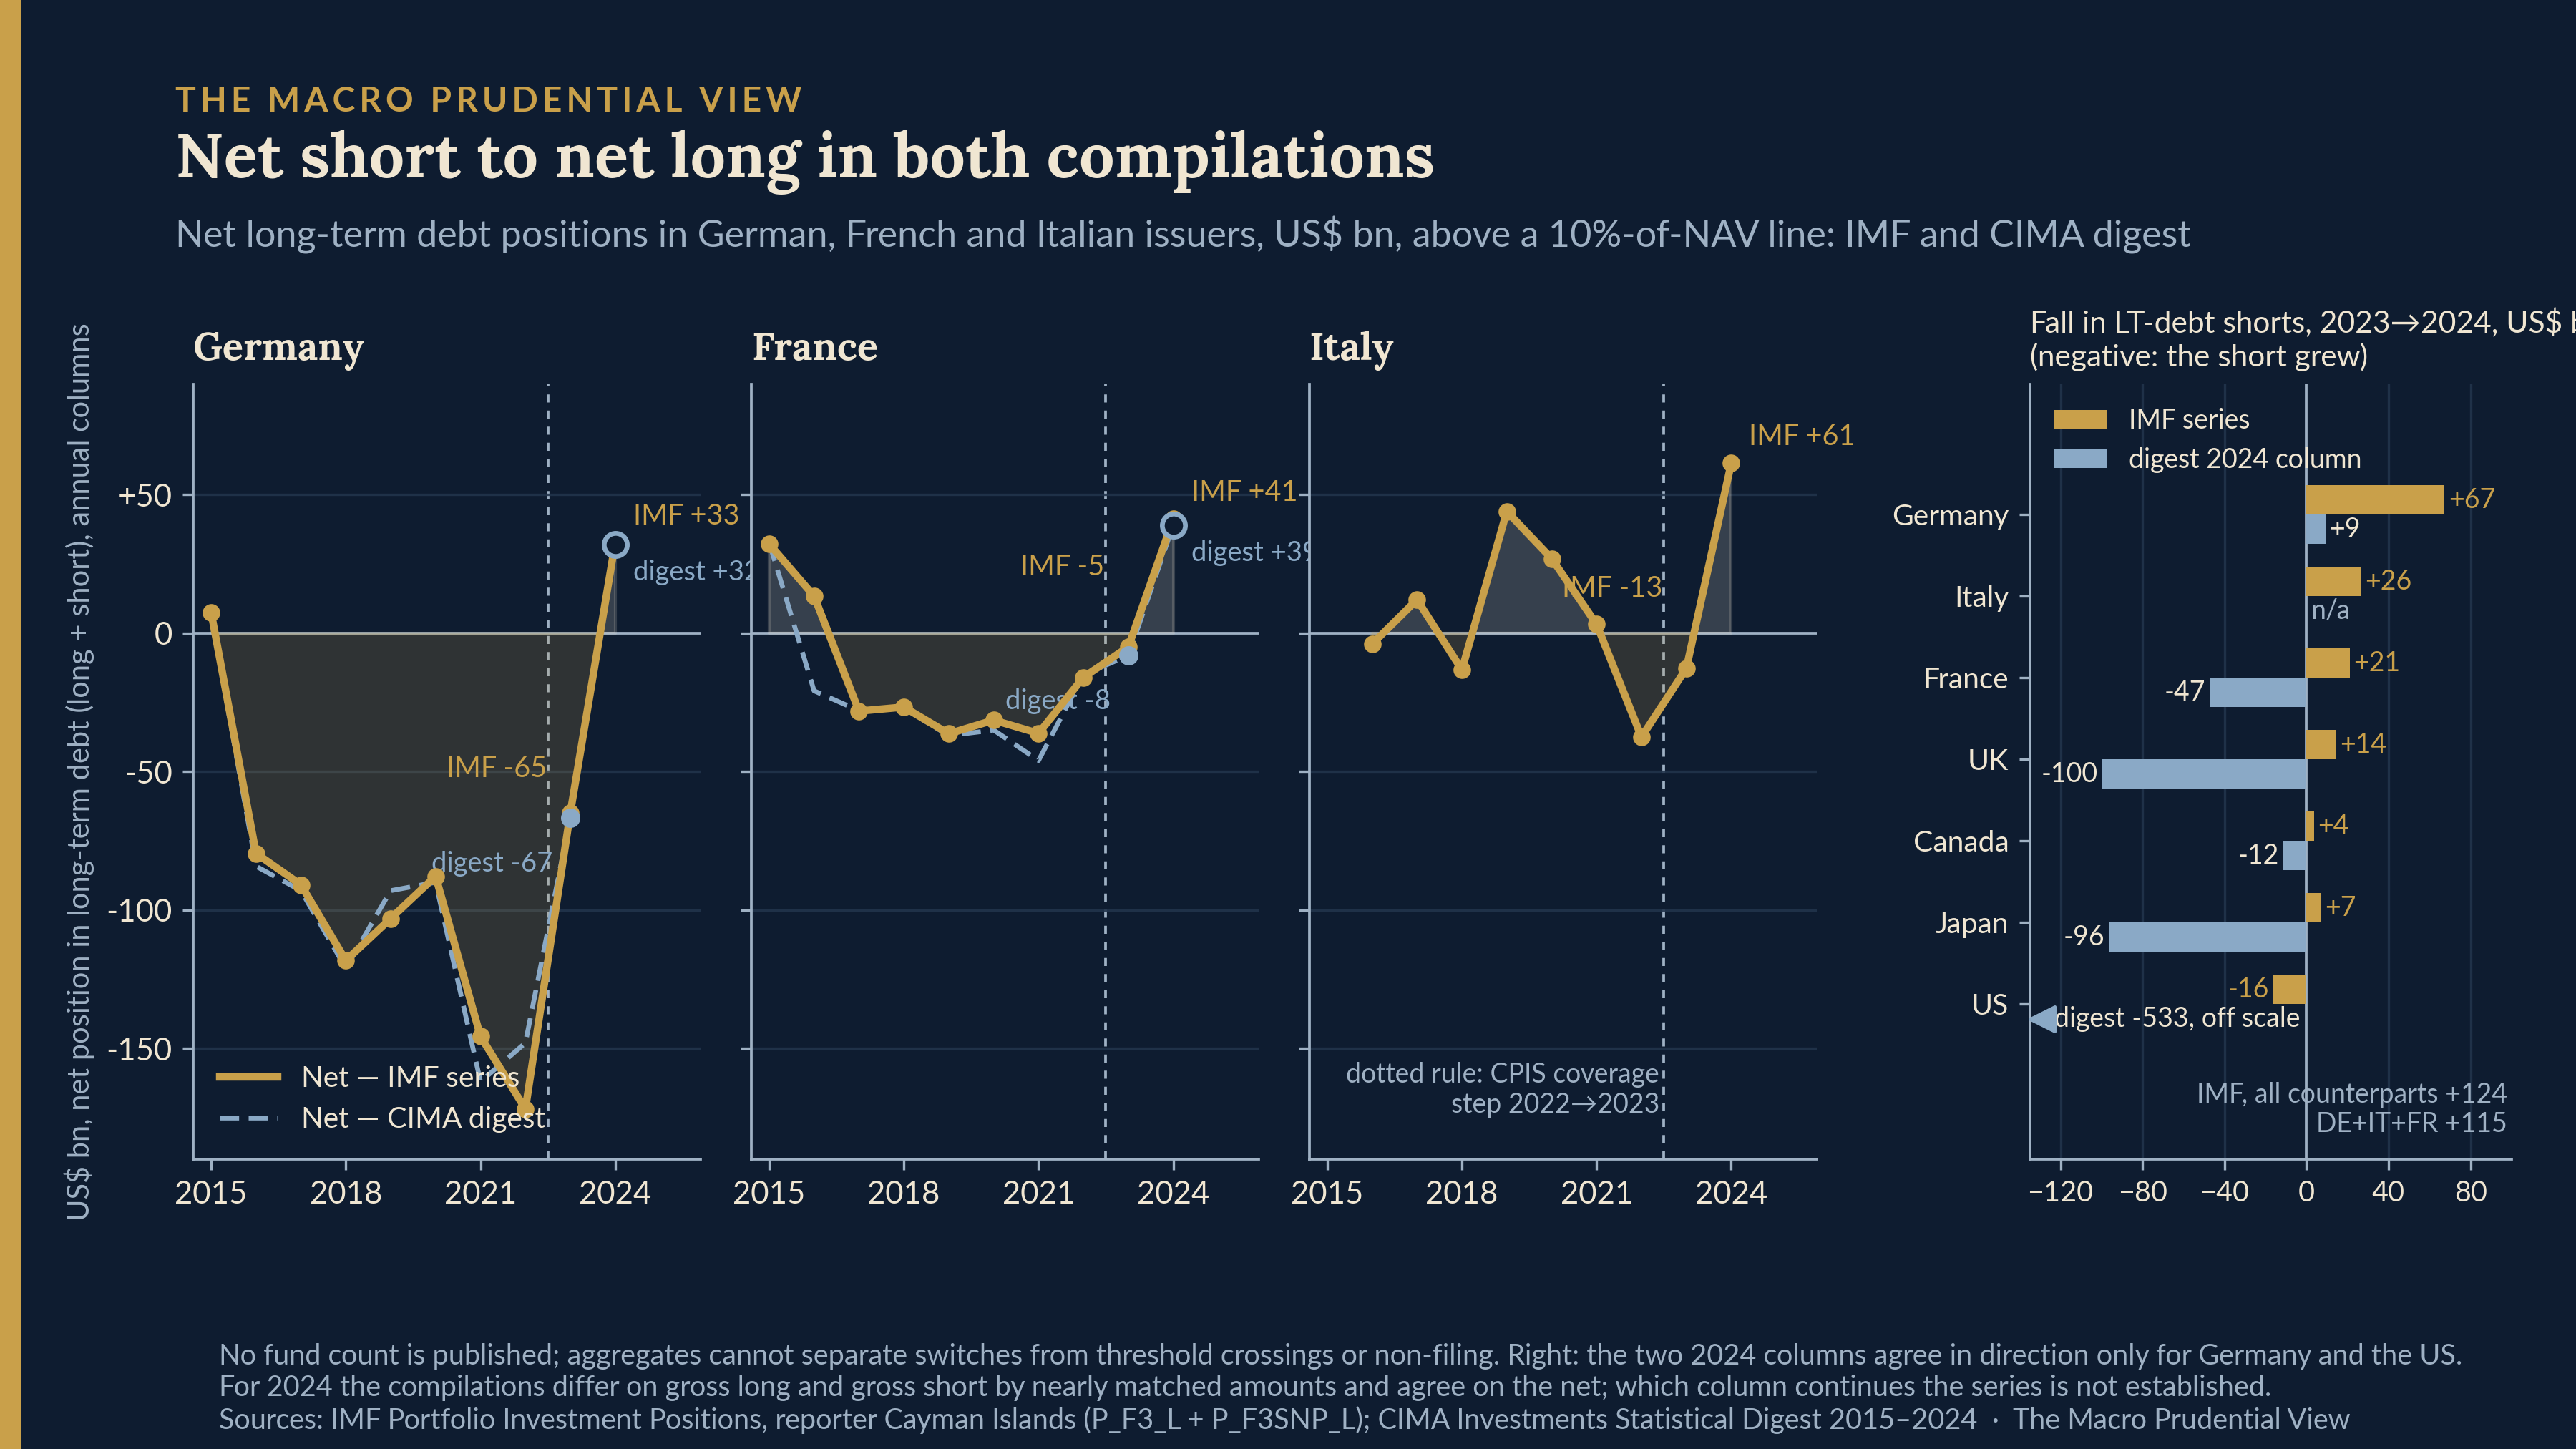
The net, in both compilations. German long-term debt in the digest: long 24, short −90, net −67 for 2023; long 113, short −81, net +32 for 2024. In the IMF series: 24.7, −89.6, −65; then 55.1, −22.4, +33. France goes from −8 to +39 in the digest and −5 to +41 in the IMF series; Italy, IMF only, from −13 to +61. Annual columns, no date inside the year, in a population not shown constant. The three nets are the third chart; its right-hand panel belongs to the next section and is read there.
The gross, and which column moved. For 2024 the digest prints total shorts of US$2,396bn and the IMF 475bn, and in every country the digest’s gross long and gross short exceed the IMF’s by nearly the same amount. Across all instruments: Germany +60 and −61, France +69 and −71, the United States +1,319 and −1,372, the United Kingdom +116 and −118, Japan +125 and −126; in German long-term debt alone, the legs printed above, +58 and −59. Subtracting close to the same amount from a long and a short is what removing, or adding, offsetting positions does; the nets are nearly untouched, and country nets agree within 1–3% (the US residual is US$53bn on a US$4.2tn book). The fourth chart puts the nine years of near-equal gross totals beside the tenth, and the 2024 nets beside each other.
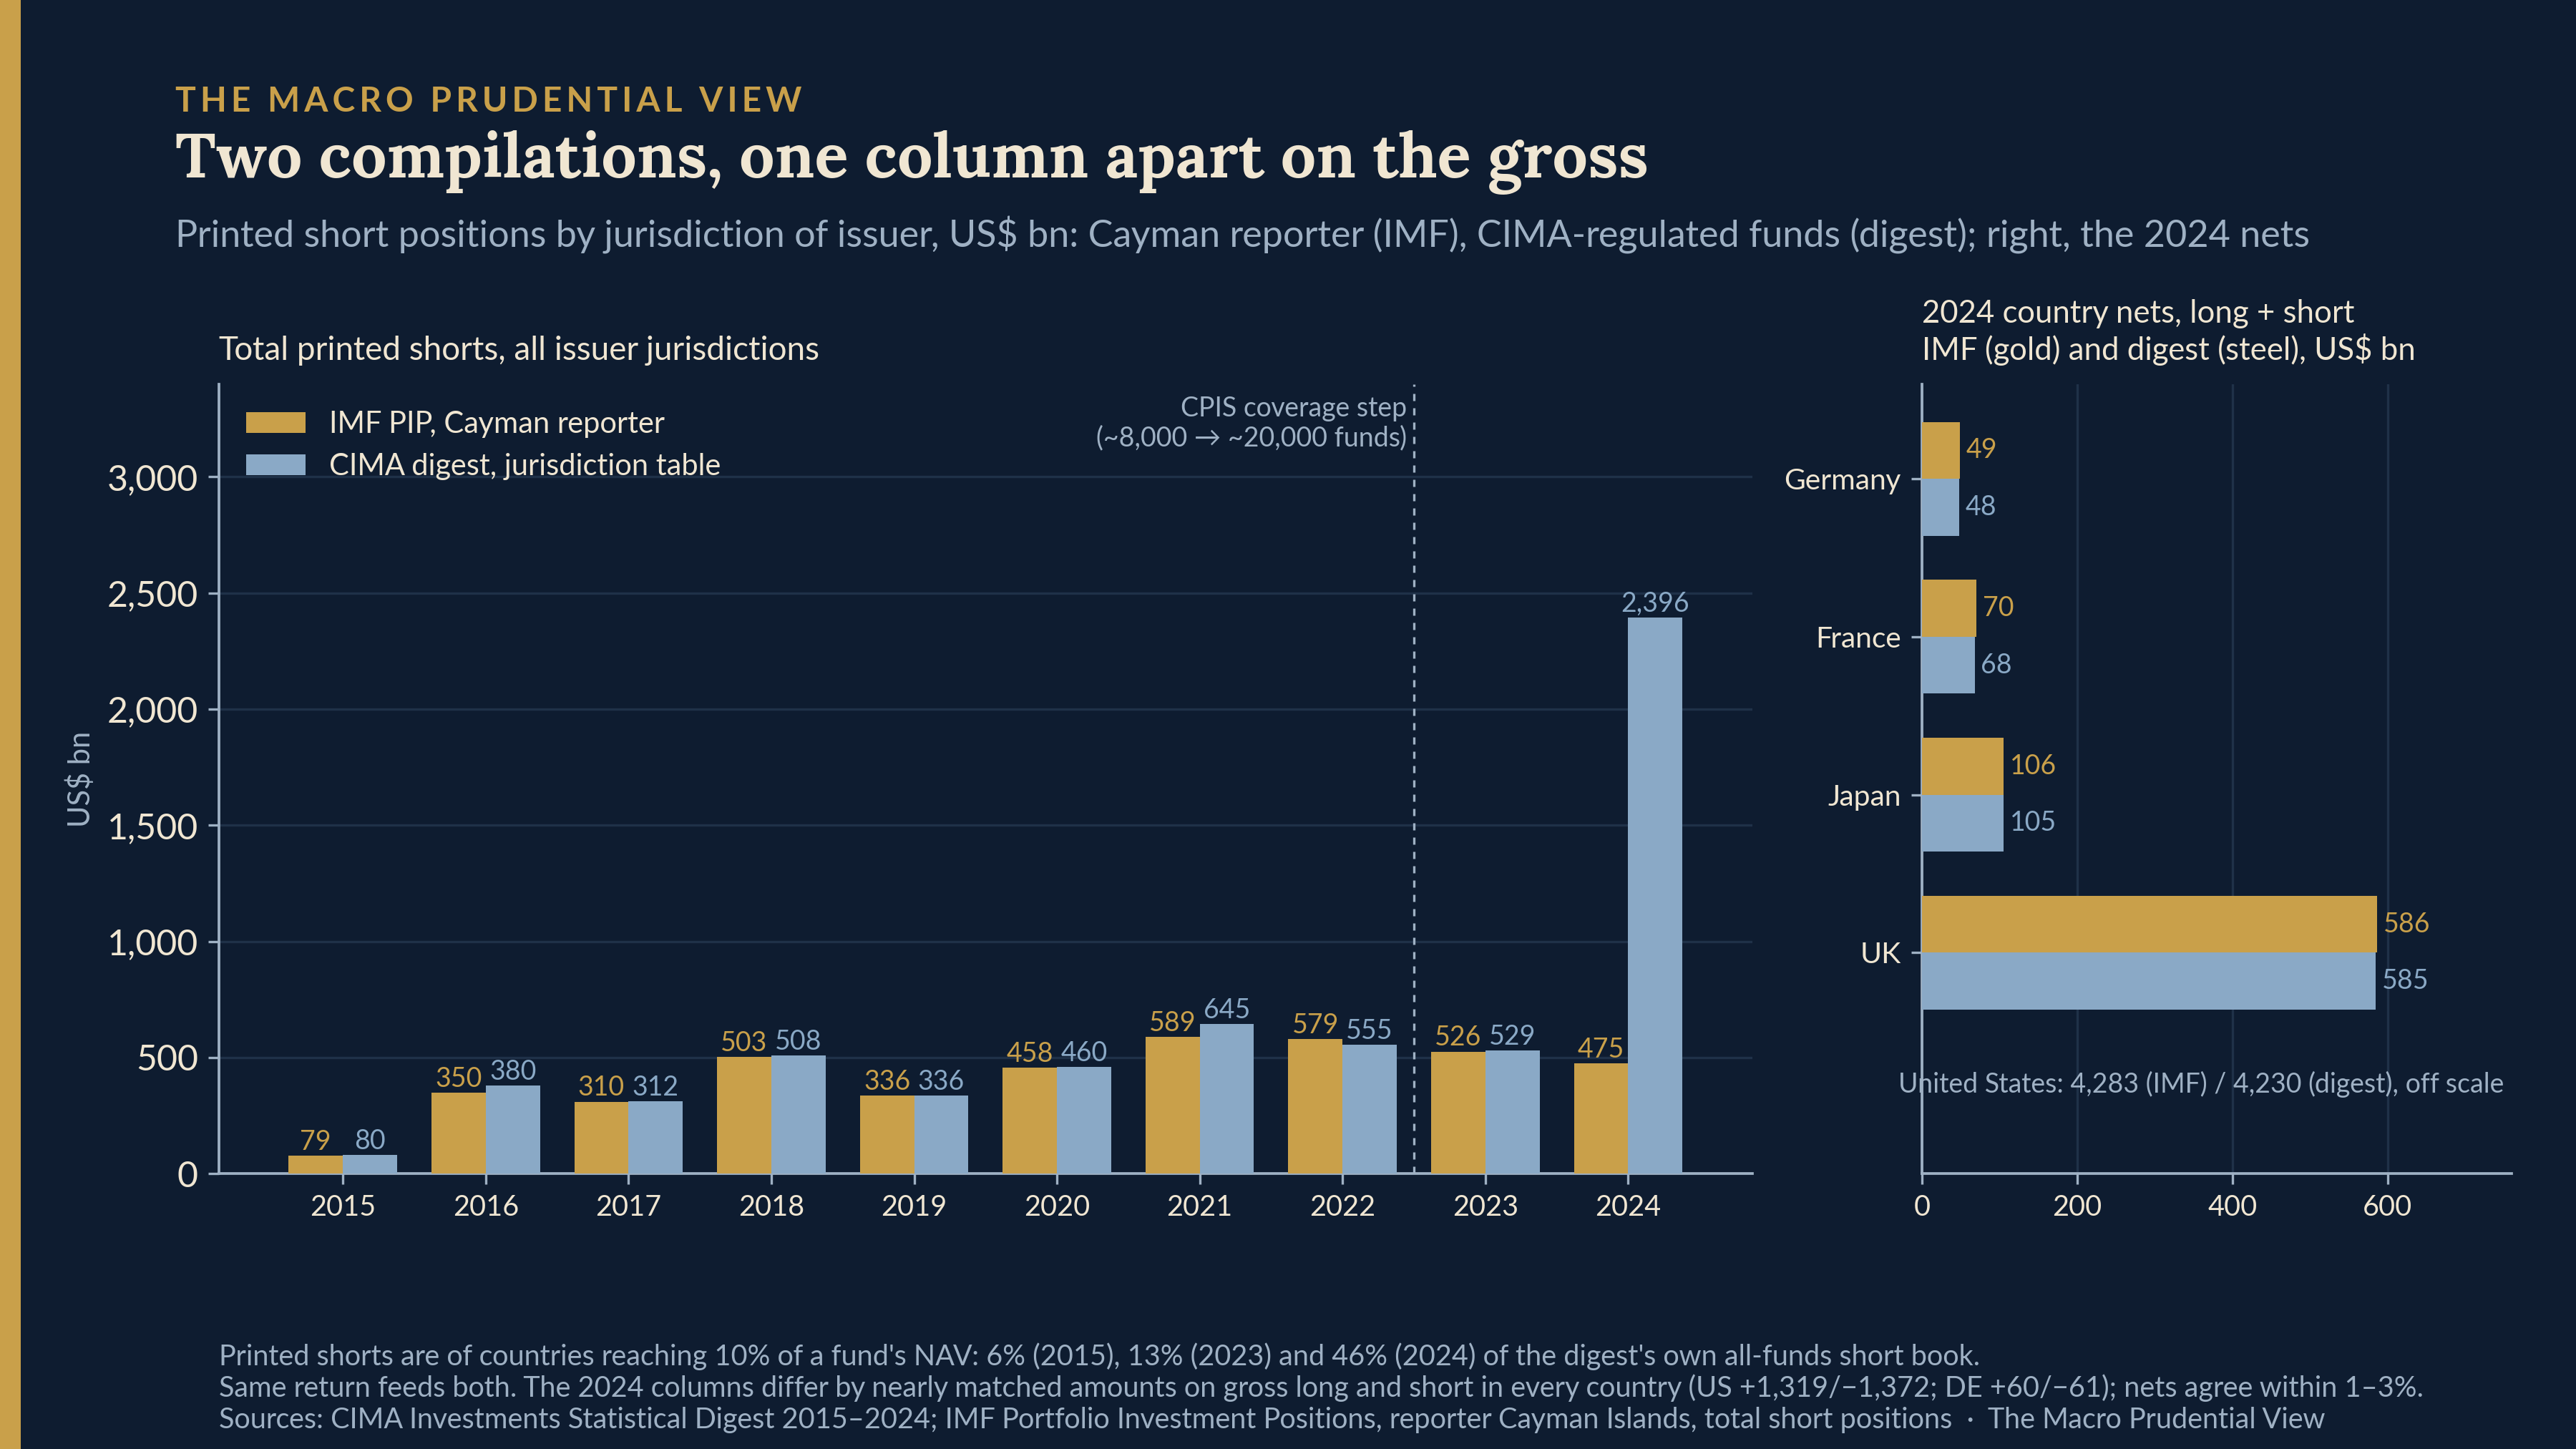
What the tables show is that the digest’s 2024 column sits far outside its own history: its printed country shorts were 6% of the all-funds short book in 2015, 13% in 2023 and 46% in 2024, while the book grew 27%; its US long-term short goes from 8bn to 542bn in one column; and the same edition moves master-fund holdings between its fund-category tables, one line from 75 to 1,266bn, another from 1,529 to 324. What they do not show is that the IMF’s 2024 column is continuous. Its total, 475bn against 526 the year before, and its 9% ratio to the book sit inside the 2015–2023 range, which is consistent with continuity and also with a new netting of offsetting positions in a year when gross positions grew (the all-funds short-bond book did grow by US$1,036bn), and the 2024 CPIS population is not published, so a coverage change on that side cannot be excluded either. Two readings, then, and they are illustrative rather than exhaustive: both compilations could have changed, and different coverage of portfolios holding offsetting positions would produce the same arithmetic as netting. Under the first the digest added offsetting positions its earlier columns excluded and the IMF series continues the nine years before it; under the second the CPIS submission netted positions its earlier submissions carried gross and the digest continues them. The tables say more against the digest column than for the IMF’s; I lean to the first reading and call it a lean, since a continuous series can only be chosen from a compiler reconciliation covering population, vintage, classification and gross-or-net treatment. CIMA has been asked which column is the intended measurement and what the matched positions are (collateral or master-feeder holdings counted on both sides in one compilation are the obvious candidates), and I will report the answer or its absence.
The turn under each reading, on numbers that are one compilation’s gross rather than a result, and with the right-hand panel of the third chart as the picture. Under the first, Cayman’s long-term debt shorts to all counterparts fell from US$269bn to 145bn, a net fall of 124bn of which Germany was 67, Italy 26 and France 21: 93% of the net fall, or 82% of the US$140bn of summed reductions among the twelve counterparts I pulled once their increases are counted separately (the largest is the US short, up 16); the twelve leave a US$2bn residual to the world figure, which bounds only the omitted net movement. Japan’s short went from −73 to −66, the United Kingdom’s from −18 to −4. The cut is concentrated in three euro-area issuers; the gap between the compilations is in every country. A uniform netting rule applied to identical books would not produce that pattern; a common rule applied to books that differ by country could. Under the second hypothesis the German short moved from 90 to 81, France’s rose from 41 to 88, every other printed short rose too (the United Kingdom’s from 20 to 119, Japan’s from 73 to 170, the United States’ from 8 to 542), and the net turned because longs were added — Germany’s from 24 to 113, France’s from 33 to 127 — as they were in every country. Under both, long-term longs rose everywhere, by US$607bn worldwide in the IMF series, and I claim nothing about the long build, which coverage or a market effect could produce.
Then the filter, which sits under everything. Section 12 is completed only for countries reaching 10% of a fund’s NAV, and eligibility is decided on the fund’s whole country book, on a basis the completion guide does not state. A German short can leave the row unchanged because other German holdings in the same fund shrank, because the fund’s NAV grew, or because the fund did not file. Filings fell: mutual-fund FAR submissions dropped from 10,775 to 7,762 between the two columns, registered funds from 7,370 to 4,247, while aggregate NAV rose 9.9%, and the jurisdiction table is not published by fund category, so the most visible population event on the page cannot be tested against the German, French and Italian rows. Timing may be part of it. A FAR is due within six months of a fund’s year-end, so a December-year-end fund’s 2024 return was due by the end of June 2025; the 2024 digest’s Infogram was created on 17 July 2025 and last updated on 30 January 2026, and whether the update refreshed the data is not stated. A column cut before late returns were in would lose the funds that file last, and if those shorts sat in funds that had not filed, or did not file, the printed net turns with no continuing fund changing anything. That, and threshold crossings, are observationally equivalent to a switch by continuing funds in every table I have. So: the printed German long-term net turned positive in both compilations for 2024; under the reading I lean to, the short was cut and the cut was euro-area-specific; under the other, longs were added book-wide; and the aggregates cannot separate either from a reporting event. The portfolio reading is a hypothesis that a matched-population reconciliation from CIMA would test.
What the series cannot say
Four limits. It is not sovereign-specific: the tables give long-term debt by country of issuer, so I write “German long-term debt” throughout and “Bunds” only where the ECB’s description is in the sentence, and no ratio to Federal securities appears here, because the denominator that would let a reader see the short against everything German as well as against Federal paper is not one I have verified. The return does collect a field that would narrow it: section 12.3, “Counterparty sector of Issuers of Investments held by funds”, on the same record as the country and the amounts, with “General Government” among eight options. That would separate German general government — the Bund, the Länder, municipalities, social security — from banks and corporates; it would not isolate Federal securities, which needs issuer or security detail the return does not carry. Neither compilation prints it; the IMF dataset has a counterpart-sector dimension and for the Cayman reporter populates only the total. Whether CIMA can tabulate it against country, instrument and side is one of the questions I have sent. It is not basis-specific: an unhedged short and a cash-short, futures-long position look identical in the table. It is not leverage: gross securities positions, no repo, no futures, no netting within a fund’s row. And it is not a census: FAR filers, at their own year-ends, for countries above a threshold applied on a basis the guide does not state, with a coverage step in the CPIS between 2022 and 2023.
Exit
A public record of the leg the public European record does not carry — the Eurosystem sees it in EMIR and SFTR; readers of the Financial Stability Review do not — has existed since 2015 in two compilations. The one holder statistic on the German side is a different object and reads accordingly: the Finanzagentur’s creditor statistic puts hedge funds’ holdings of Federal securities at €25bn at end-March 2026, down €7bn on the year and about 1% of the total, and adds that their importance as holders “bleibt weit hinter ihrer wichtigen Rolle im Handel zurück”, stays far behind their role in trading. That is a holdings estimate, since 2026 built from the Bietergruppe’s trading data, whose treatment of short sales and lending is not published; it is a separate statistic rather than the other side of the Cayman tables, and gross shorts several times its size do not contradict it. It sits beside what Code 12 found at the issuer’s auction window, where allotment tables put hedge funds at 1% of French syndications and a few per cent of Italian ones while dealer-reported auction demand puts them above 40% of Italian orders. Two ends, two objects, kept apart.
The Fund Annual Return asks for country (section 12.1), currency (12.2) and issuer sector (12.3). The digest prints country by instrument. The IMF prints country by instrument. The sector column that would separate German government paper from everything else issued in Germany is collected and unpublished. The reconciliation between the 2023 and 2024 columns that would say whether anyone changed position — continuing funds, entries and exits, threshold crossings, valuation, compilation — does not exist as a column and has been requested. Until the answers come, the German short in Grand Cayman is what the tables say it is: ten years of printed positions above a line in which Germany was first among the countries printed in seven, and a 2024 net that turned positive in two compilations that no longer agree about the gross. The doom loop’s second geography argued that the euro-area sovereign–NBFI nexus cannot be joined from EU data alone. This is a non-EU authority publishing one side of it, in a return that also reaches the IMF, with the two columns that would make it useful left inside the return.
Paweł Fiedor — The Macro Prudential View
Views are my own. This article is a personal analytical piece based on public sources. It does not represent the views of the European Systemic Risk Board, the Central Bank of Ireland, the Eurosystem, or any other institution.
CIMA
Cayman Islands Monetary Authority, Investments Statistical Digest, editions 2015 to 2024 — the “Portfolio Investments by Jurisdiction” tables (2015–2019 editions as PDF figures 9, 9(b), 10(a); 2020–2024 editions as Infogram embeds, the 2023 edition at e.infogram.com/1733fec4-2e19-4caf-894b-9c1847e2a9a4); the 2015 edition’s statement of purpose (p. 10), population definition and submission count (p. 3), and the sentence on short positions (p. 12); the 2017, 2018 and 2019 sentences on Germany; the 2024 edition’s asset-allocation and fund-category tables, its fund-count and FAR-submission table, its text on the 83.18% submission rate and aggregate NAV, and its Infogram metadata (created 17 July 2025, updated 30 January 2026).
Cayman Islands Monetary Authority, Fund Annual Return Completion Guide, FAR-016-22-04, May 2022 — section 12 (p. 20) for the 10%-of-NAV rule and the instruction on short and long positions; section 12.1–12.3 for the country, currency and counterparty-sector fields and the eight sector options; sections 9.8–9.9 for derivatives; “A FAR must be filed within six (6) months of the mutual fund’s year-end” for the deadline. Re-read from CIMA’s PDF on 6 September 2026. The guide has not been revised since May 2022.
IMF
International Monetary Fund, Portfolio Investment Positions (formerly the Coordinated Portfolio Investment Survey), dataflow IMF.STA PIP 5.0.0, publication of 11 March 2026 — reporter Cayman Islands; indicators P_F3SNP_L_P_USD (short or negative positions, long-term debt securities), P_F3_L_P_USD (long-term debt securities), P_TSNP_P_USD (total short or negative positions) and P_TOTINV_P_USD; counterpart economies DEU, FRA, ITA, GBR, JPN, USA, CAN and the world aggregate; holder sectors S1, S122, S12R, S12QU; counterpart sector S1 only. Read through the IMF’s SDMX API on 5 September 2026.
International Monetary Fund, Cayman Islands: Technical Assistance Report — Report on External Sector Statistics Mission (September 30–October 11, 2024), Technical Assistance Report No. 2025/024, published 12 March 2025 — paragraph 42 for CPIS coverage (”from about 8,000 investment funds at the end of 2022 to about 20,000 at the end of 2023”) and for CIMA as the compiler; paragraph 39 for the Fund Annual Returns as the collected data.
ECB, ESRB, Banca d’Italia
European Central Bank, Financial Stability Review, May 2024, Box 3, Financial stability risks from basis trades in the US Treasury and euro area government bond markets — the four sentences quoted.
European Systemic Risk Board, EU Non-bank Financial Intermediation Risk Monitor 2025, 1 September 2025, section 1.1, Chart 2 panel b and the text beside it — the €100bn and €115bn figures, the label “market participants based in the Cayman Islands, some of which pursue hedge fund strategies”, and the note giving 20 December 2024 as the latest observation.
Banca d’Italia, Financial Stability Report No. 1 – 2026, April 2026, p. 14 — the sentence on the net debtor position in Italian government bond repo since mid-2024.
Deutsche Finanzagentur
Bundesrepublik Deutschland – Finanzagentur, Gläubigerstruktur (creditor structure of Federal securities), as at 31 March 2026 — “Hedgefonds hingegen reduzieren ihre Bestände um 7 Mrd. € auf 25 Mrd. €. Ihre Bedeutung als Halter von Bundeswertpapieren bleibt weit hinter ihrer wichtigen Rolle im Handel zurück”, and the note that from 2026 the statistic is based on the trading data of the members of the Bietergruppe Bundesemissionen. The “about 1%” is my ratio to the total the same page implies. Translation mine.
ECB reference rates
European Central Bank, euro foreign exchange reference rates, USD per EUR, last business day of each year 2015–2024 (series EXR.D.USD.EUR.SP00.A).
Data and code
The ten digest tables as extracted (every jurisdiction row, both columns of each edition, long and short by instrument, 3,295 rows), the IMF series by counterpart and by holder sector, the 2023–2024 country-by-instrument discrepancy table for both compilations, the ECB reference rates and the Finanzagentur outstanding-volume series, with the extraction code and checksums, are released with this piece, with a README on how each table was read and the source anomalies kept as printed. Where a printed table contained an evident error it is kept verbatim in the files and noted (the 2018 PDF’s scrambled German and Irish long rows, restated in the 2019 edition; one column-sum failure in the 2020 edition).
Calculations. Nets are long plus short from the same compilation and year. Concordance is the digest’s value against the IMF’s for the same country, instrument and reporting year, as a percentage of the IMF’s. The table-to-book ratio is the jurisdiction table’s total printed shorts over the digest’s own all-funds short bonds plus short equities in the same edition. The 93% is the fall in the IMF’s long-term debt short for Germany, Italy and France (114.8bn) over the fall in its world aggregate (124.0bn); the 82% is the same numerator over the sum of all country-level reductions among the twelve counterparts pulled (139.7bn), with increases (18.1bn, of which the United States 16.1) counted separately and a 2.4bn residual to the world figure. Euro figures are dollar figures at the ECB’s year-end reference rate. Digest positions are as at each fund’s own financial year-end and are called reporting-year aggregates; the IMF columns carry a 31 December reference date whose relation to the fund year-ends is not published; “for 2023” means the 2023 column of each compilation.