
The market that learned to bend
Or: why the machines didn't save us — but something did


On 2 April 2025, the US administration announced a wall of tariffs, and the market did what markets do when the rules of global trade are rewritten overnight. The VIX spiked to 52 — its second-highest intraday peak since the COVID crash. Treasury volatility, measured by the MOVE index, jumped to levels last seen during the 2023 banking crisis. European equity volatility followed. For a few days the screens looked the way they look before a central bank picks up the phone.
And then nothing happened. No emergency facility. No unscheduled meeting. No statement promising to do whatever it takes. The Federal Reserve, which was at that moment still shrinking its balance sheet, carried on shrinking it. The market repriced, found a level, and moved on.
This is the kind of episode that invites a comforting story. The comforting story goes like this: modern markets are electronic, deep, and fast; algorithmic market-makers provide liquidity continuously and reprice risk in milliseconds; we have, through some combination of technology and hard-won experience, built markets that absorb shocks on their own. Two wars and a trade war in four years, and the system held. Perhaps the machines have made us anti-fragile.
I want to take that story seriously, because a version of it is true. But the cleaner reading of the evidence is that it is incomplete about why — and getting the why wrong has real consequences for anyone whose job is to keep the system standing.
The calm is selective
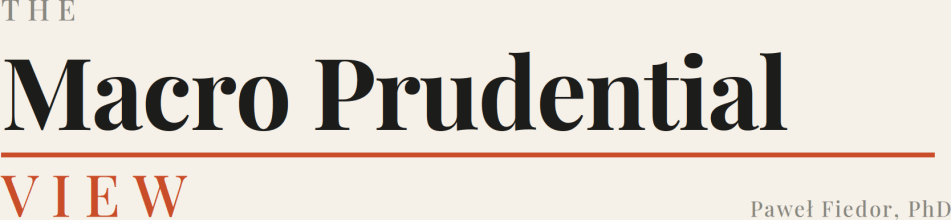
Start with the texture of the last few years, because “markets were calm” is too coarse a claim to be useful.
The point is not that one market was calm and another wild. It is that “the system” is not one thing. Each of these markets has its own microstructure, its own participants, its own plumbing — and they broke, or didn’t, for different reasons. The shock that froze the gas market in 2022 left equities largely untouched; the shock that drove the MOVE index to a banking-crisis high in March 2023 was a banking crisis, not a vol event. If we want to know whether markets have become more resilient, we have to ask the question market by market, mechanism by mechanism — not wave at an index and call it calm.
It is worth holding one distinction in mind from the outset, because the whole argument turns on it. There is a difference between a repricing shock — where asset prices move violently as the market digests new information — and a funding shock, where the problem is not the level of prices but the inability to finance positions at any price. The two can look similar on a volatility chart. They are not similar in the plumbing, and as we will see, that difference is what separates a market that bends from one that breaks.
A decade of rising rescues
Here is the fact that the comforting story has to explain away.
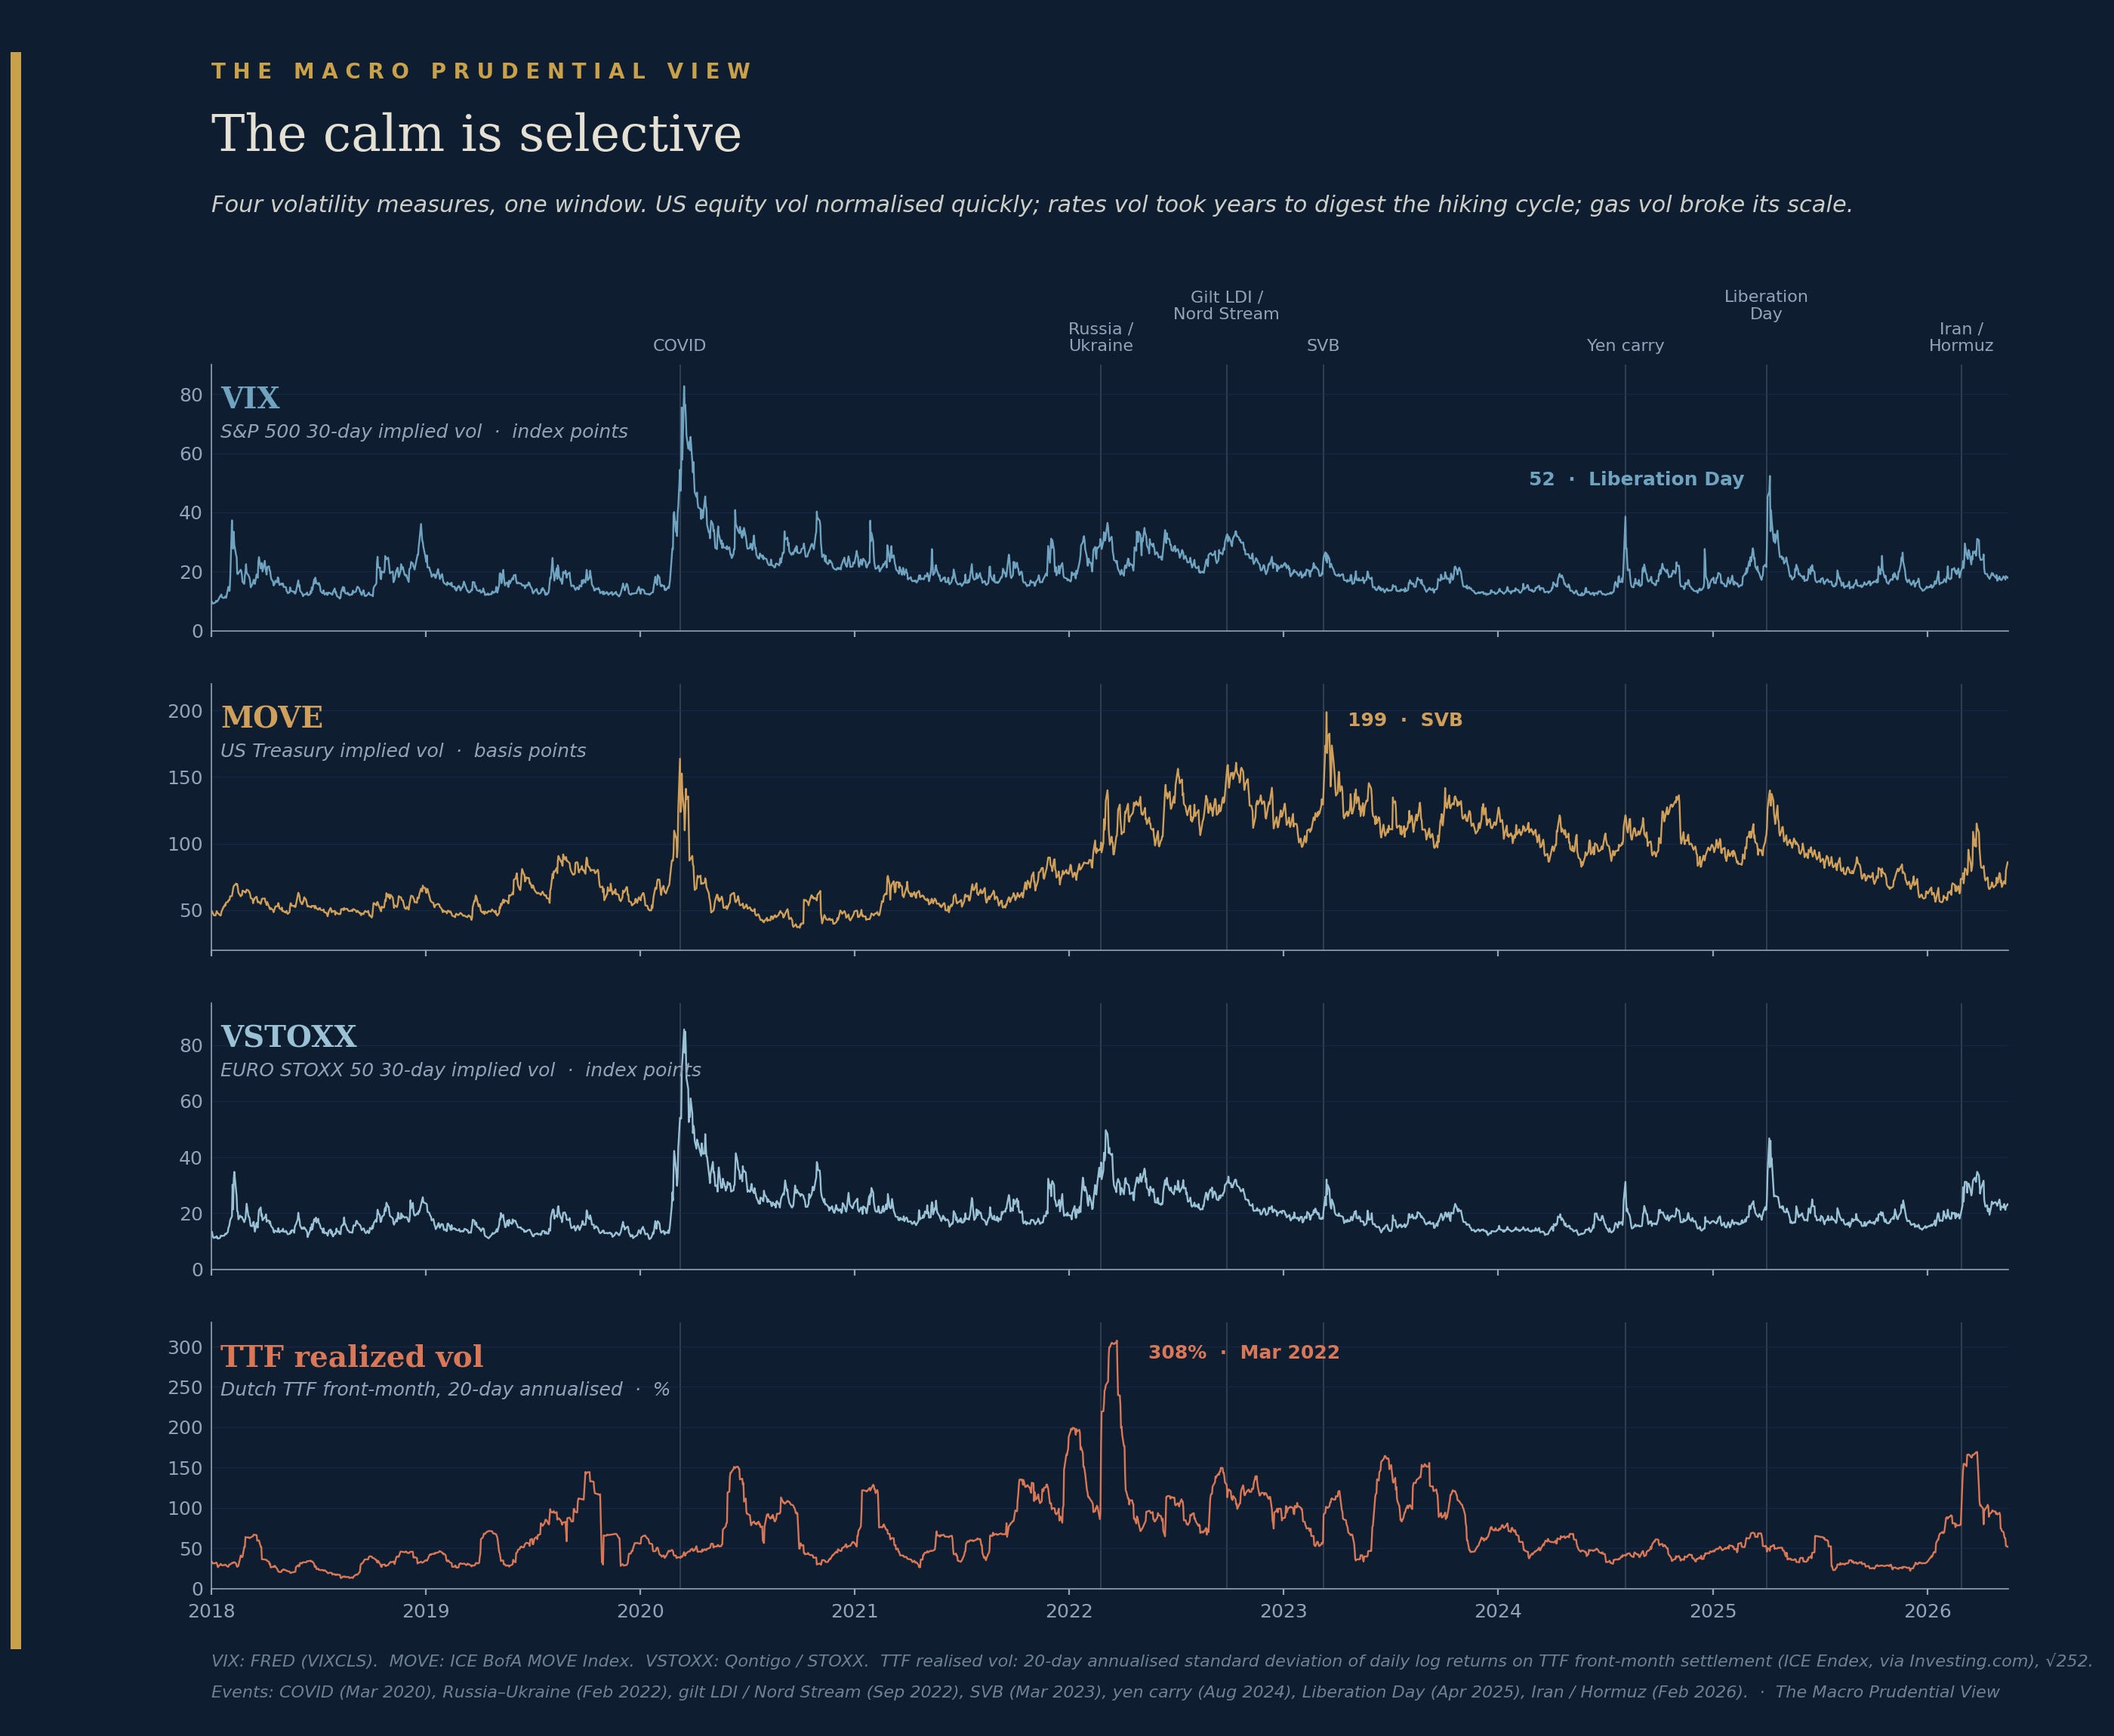
For most of the post-crisis period, the official sector was called in with rising frequency. The chart above plots the major liquidity-event episodes since 2010 — the 2010 Flash Crash, the October 2014 Treasury flash rally, the August 2015 ETF dislocation, the 2016 sterling flash crash, 2018’s “Volmageddon,” the September 2019 repo spike, the March 2020 Treasury dysfunction, the 2022 LME nickel suspension and retroactive trade cancellation, the September 2022 gilt/LDI doom loop, the March 2023 banking failures, and the August 2024 yen carry unwind — and beneath them, the cumulative count of episodes that drew an official response.
The line steepens. Six events in the first decade; five more in the four years after. And the nature of the response escalated alongside the frequency. The early episodes drew rule changes — circuit breakers after the Flash Crash, reporting requirements after 2014, product delistings after Volmageddon. No public money. From 2019 onward, every episode drew the balance sheet: emergency repo operations, unlimited quantitative easing, the Bank of England’s gilt purchases, all deposits backstopped at Silicon Valley Bank, the Swiss authorities’ rescue of Credit Suisse. The system moved from adjusting the rules to deploying the central bank’s own balance sheet. That is a meaningful escalation, and it is the part of the record that should make anyone cautious about declaring victory.
And then — the cumulative line goes flat. After the March 2023 banking crisis, three shocks of comparable scale arrived, and none of them drew a backstop. The yen carry unwind in August 2024, which sent the Nikkei down 12.4% in a single session — its largest one-day fall by points in history — drew nothing more than verbal guidance from the Bank of Japan. Liberation Day in April 2025 drew nothing. The Iran/Hormuz shock in February 2026 drew nothing. Three loud shocks, no balance sheet.
I have classified the yen carry episode as “absorbed” rather than as an intervention, and that is a judgement worth defending openly. The Bank of Japan did say something — its deputy governor signalled that the Bank would not raise rates while markets were unstable. But it committed no public balance sheet, opened no facility, and bought nothing. For a chart whose vertical axis is the deployment of official liquidity, jawboning belongs on the “absorbed” side of the line. A purist could disagree; I have noted it rather than hidden it.
What the central bank had to do — and didn’t
The intervention timeline makes a claim; the cleanest way to test it is to look at the backstop itself.
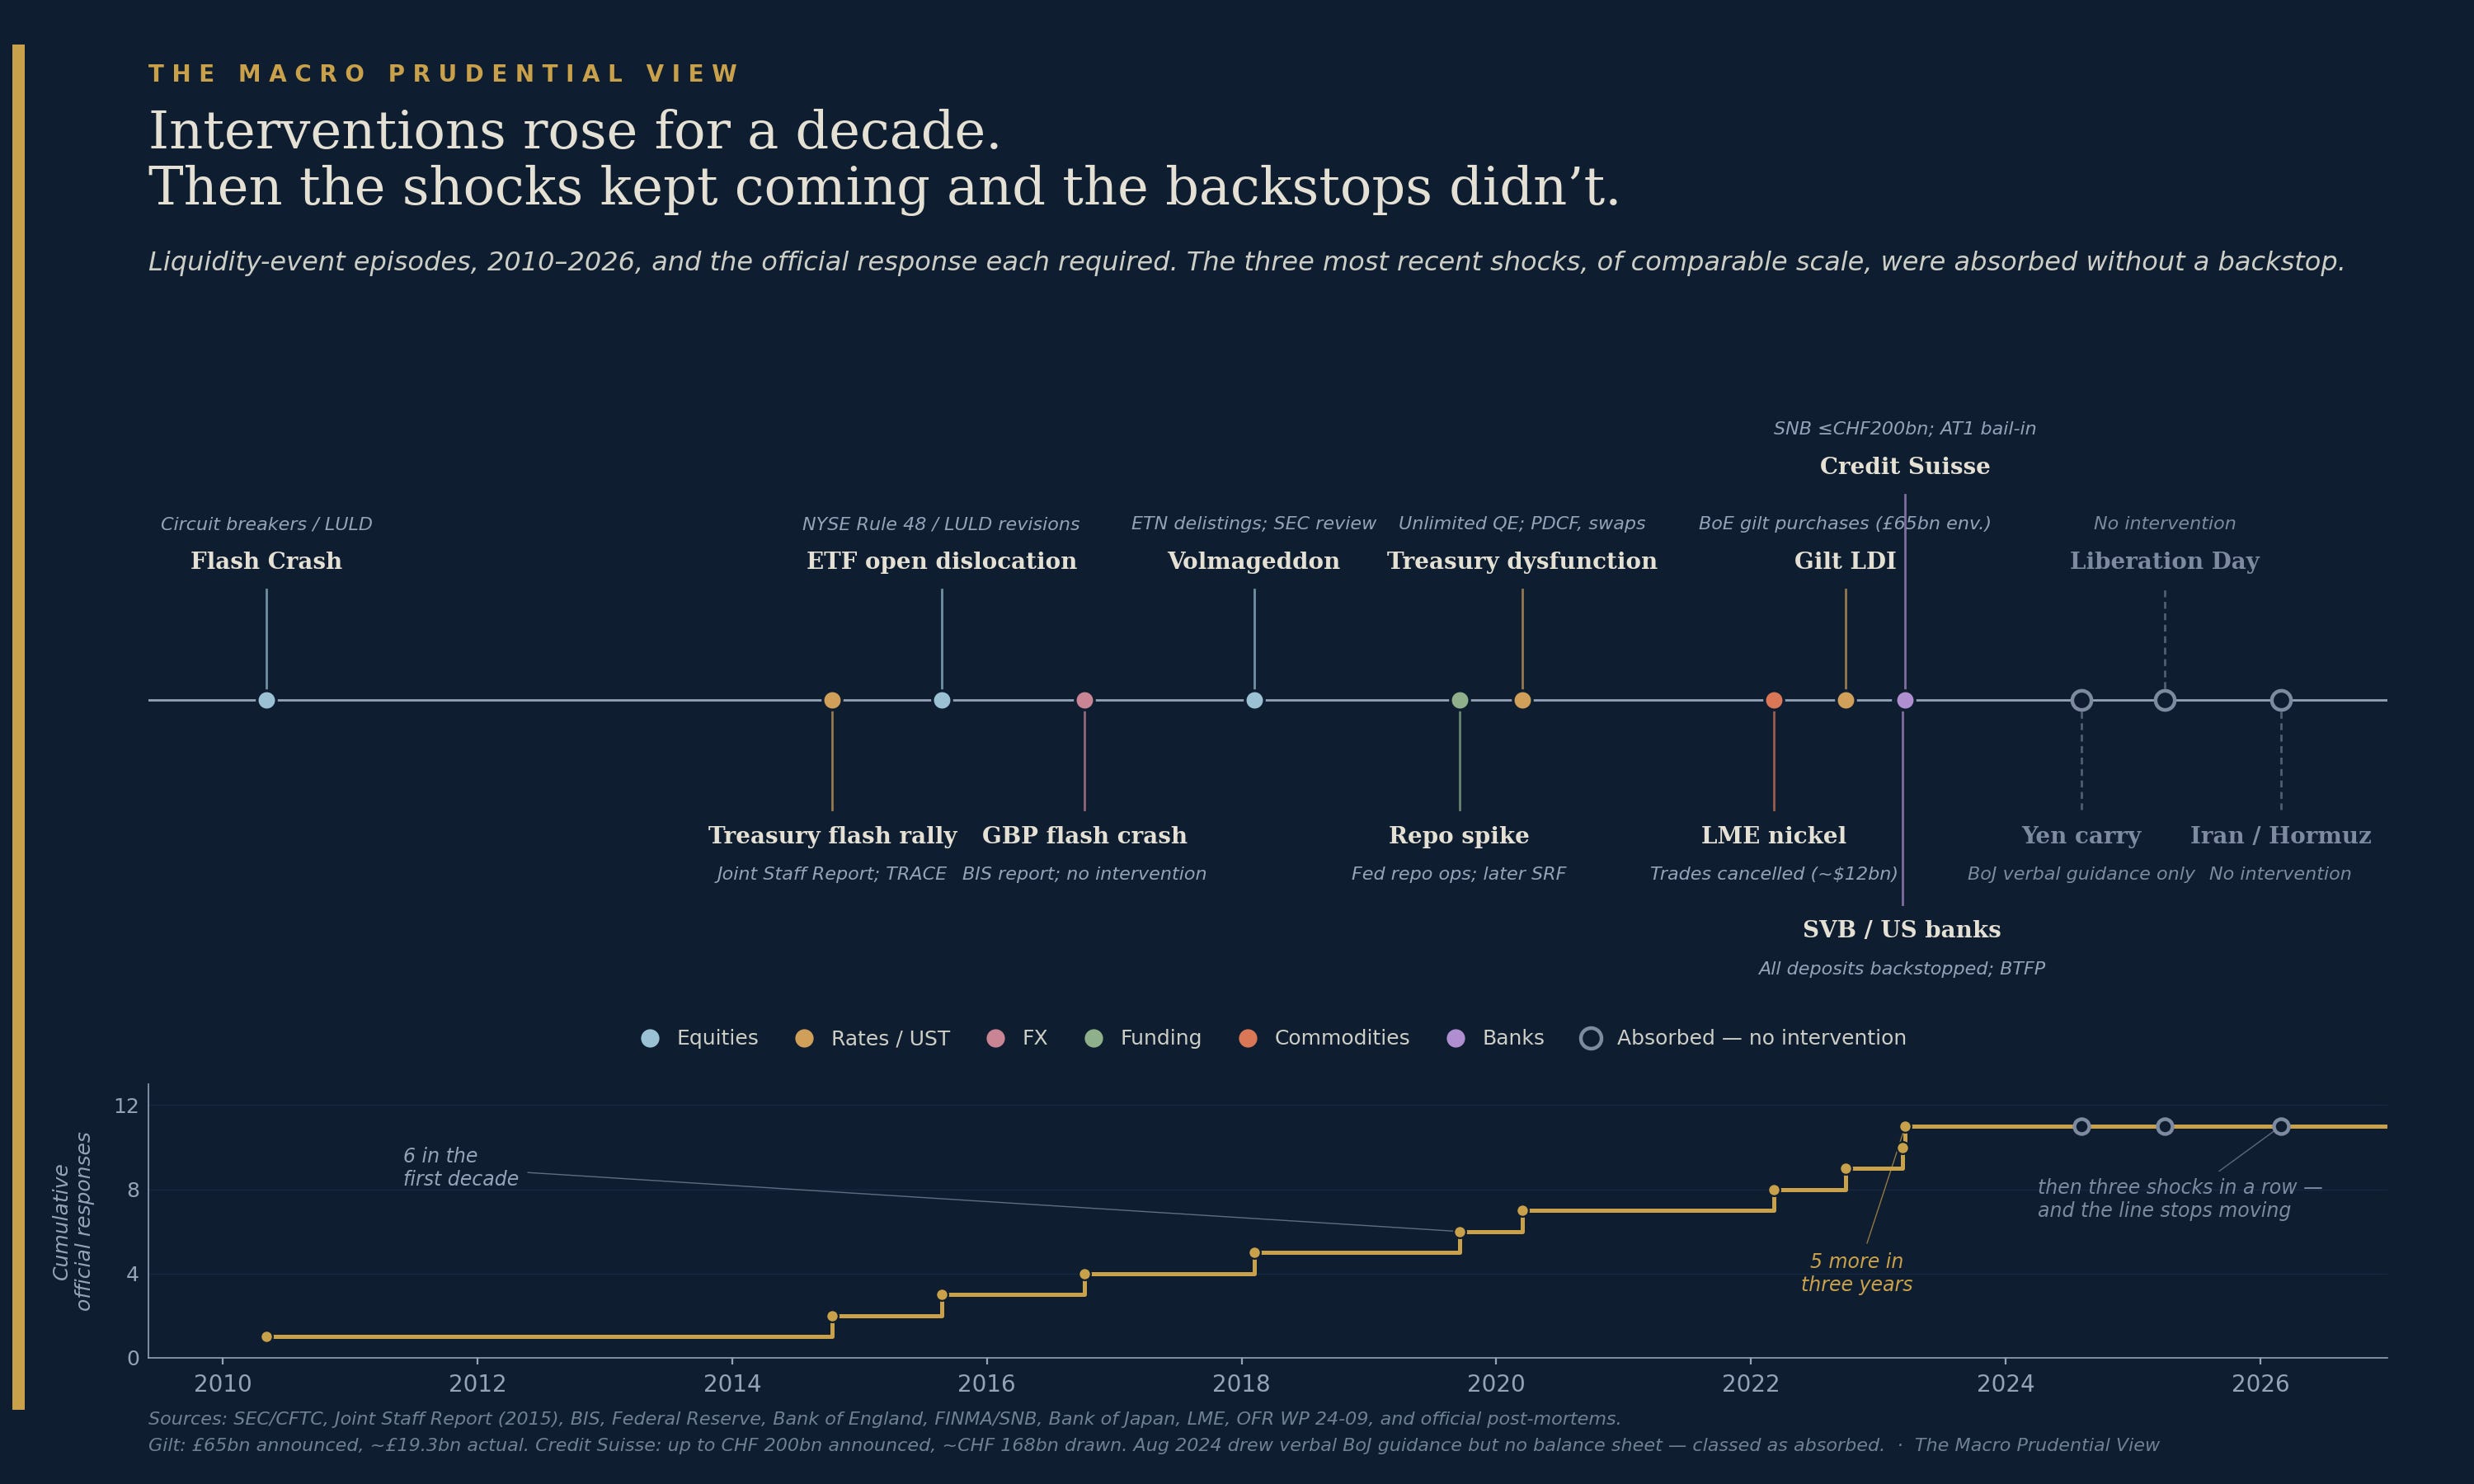
The chart above shows the weekly change in the Federal Reserve’s Treasury holdings during two windows, on a single shared scale. The left panel is the spring of 2020. The bars climb a wall: the Fed added more than $360 billion to its Treasury portfolio in a single week, and roughly $1.7 trillion over a few months, simply to keep the market clearing. This was not stimulus. It was plumbing — the central bank becoming the buyer of last resort because private dealers could no longer absorb the flood of selling.
The right panel is the spring of 2025, on the same axis. It is almost flat. Through Liberation Day, the largest weekly move is a reduction of about eighteen billion dollars — because the Fed was running quantitative tightening, draining its balance sheet at a deliberate, pre-set pace, and a market shock that would once have hijacked monetary policy did not so much as interrupt the runoff. The Treasury runoff cap had been reduced to $5 billion a month from April 2025; the balance sheet was barely moving by design, and the shock did not change that. (Runoff finally ceased entirely on 1 December 2025, for reasons that had nothing to do with any acute event.)
That contrast is the argument. In 2020, the shock forced the central bank to reverse course violently. In 2025, a comparable shock did not register as a reason to pause a trickle — not because the stress wasn’t real, but because nothing about it required a balance-sheet response.
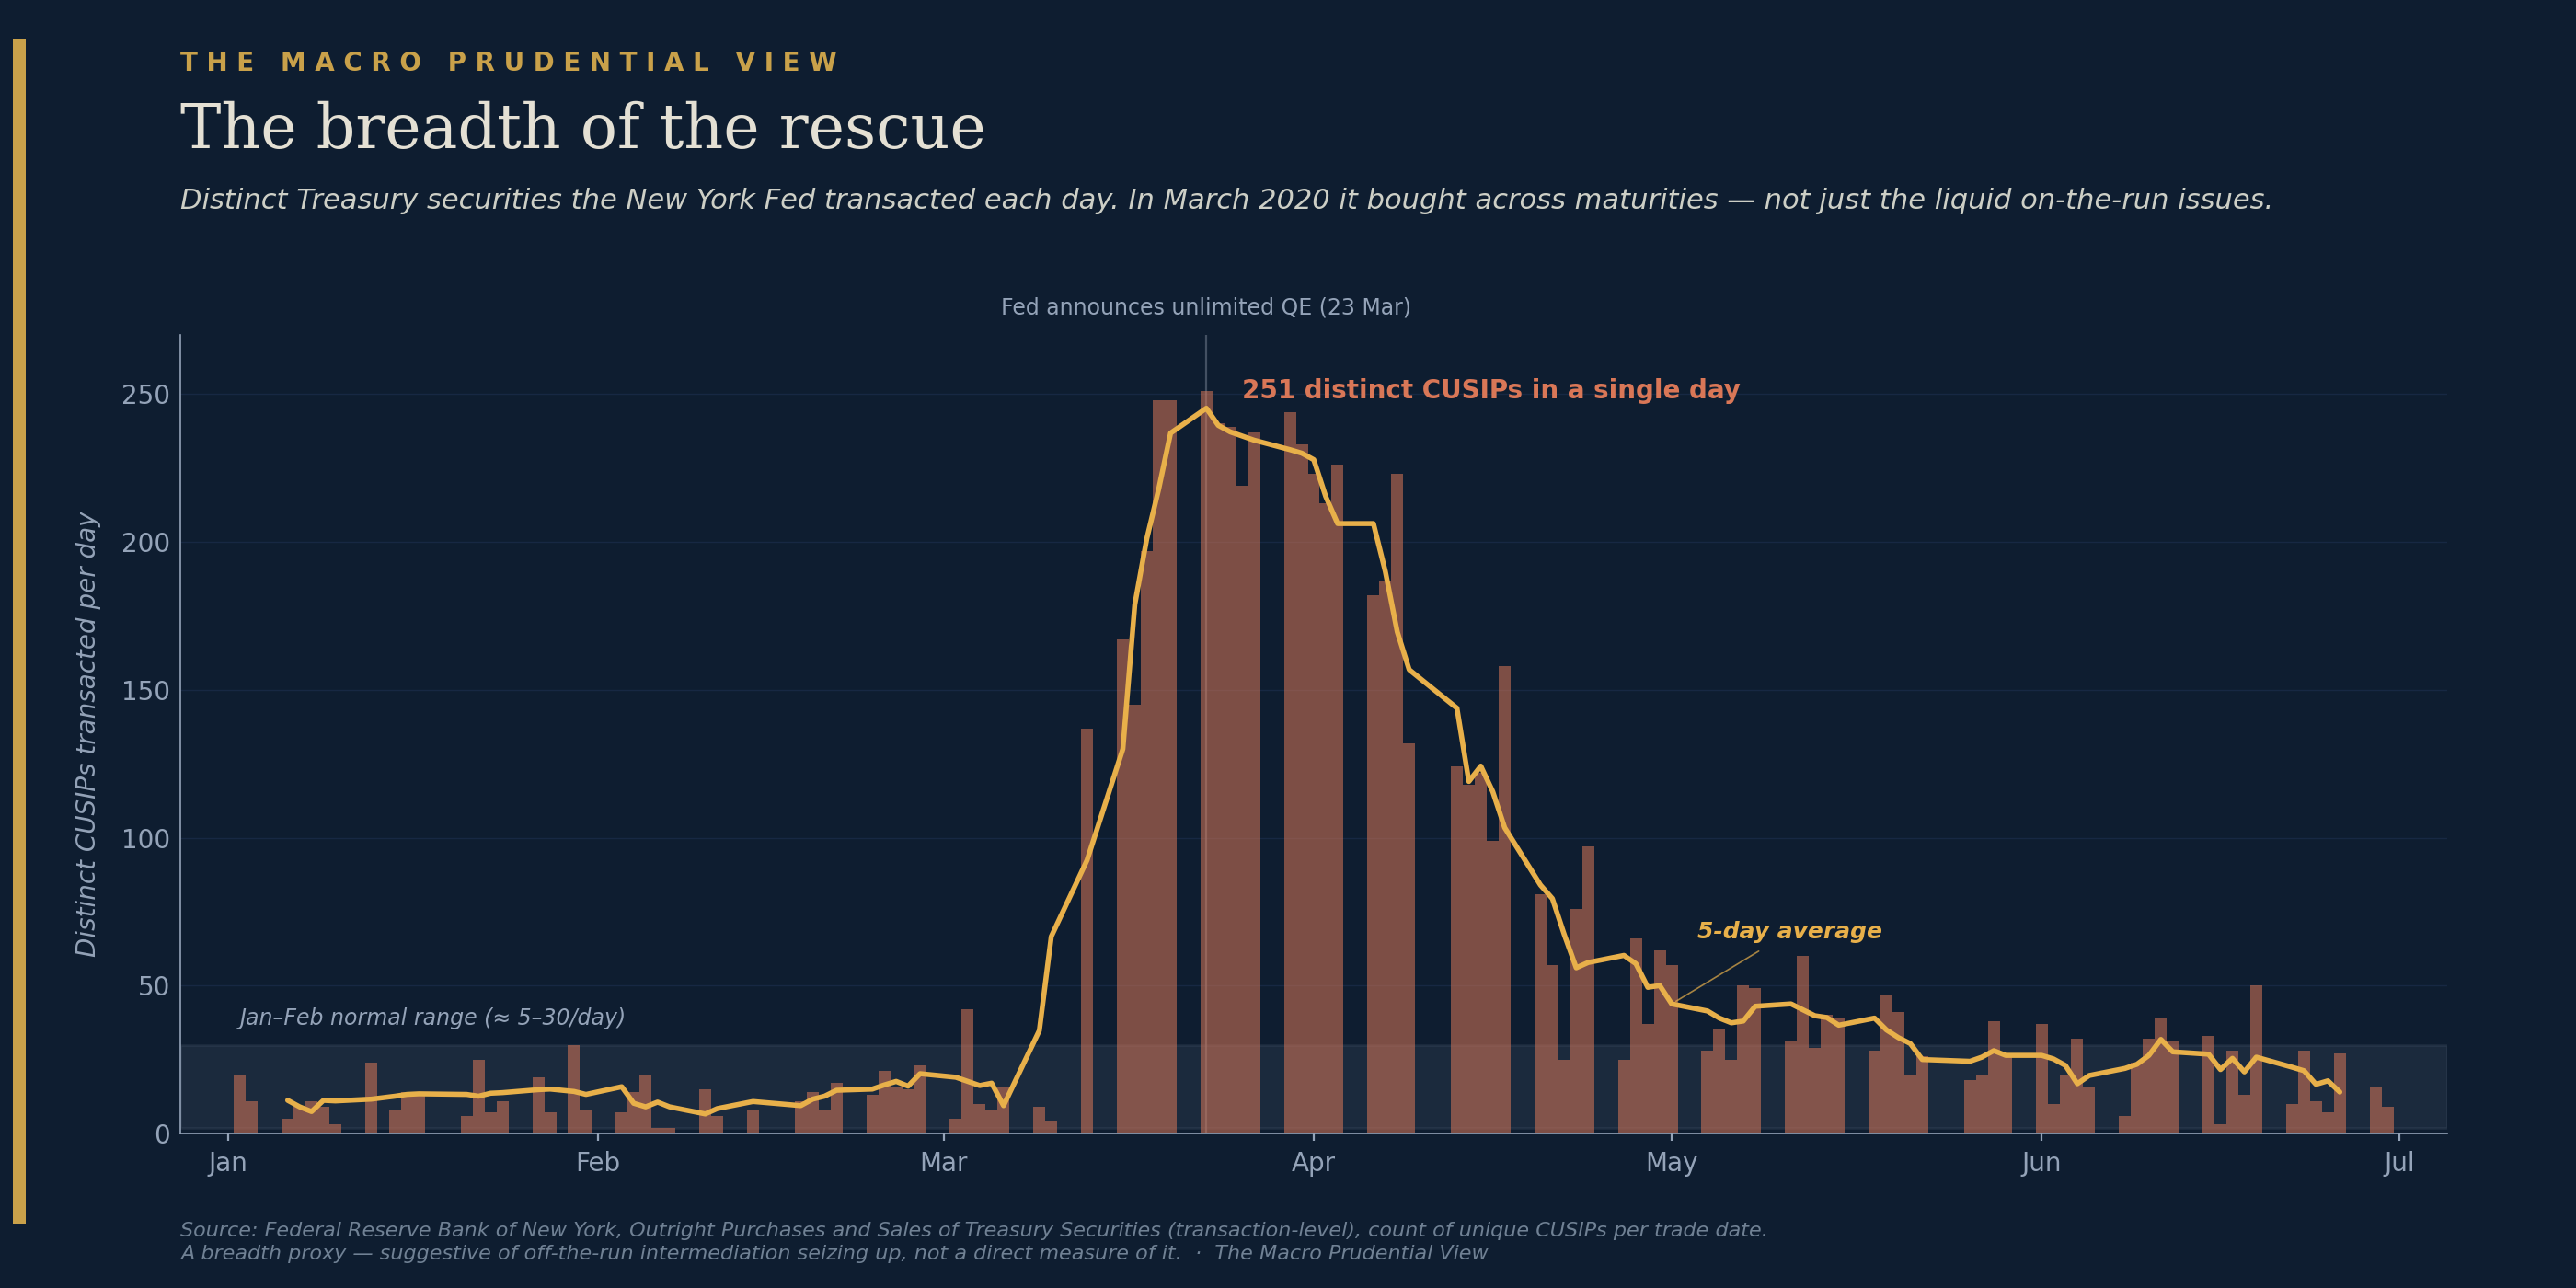
It is worth pausing on just how deep the 2020 dysfunction ran, because it sets the bar for what “the plumbing breaking” actually looks like. In normal times the New York Fed transacts in a narrow band of liquid, on-the-run Treasury issues — a few dozen distinct securities on a busy day. In the dash-for-cash of March 2020, that number exploded to more than 250 distinct securities in a single day. The Fed was not fine-tuning; it was buying across the entire curve, absorbing the old, illiquid, off-the-run issues that dealers would no longer hold. The breadth of what the central bank had to hold is itself a measure of how completely private intermediation had seized. (This is a 2020-only series — the transaction-level data is released with a two-year lag — so it cannot speak to the recent episodes. It is here as a yardstick for the depth of genuine dysfunction, not as part of the resilience comparison.)
The shape of a market that bent without breaking
So the recent shocks were absorbed. But “absorbed” can mean two very different things, and the distinction matters enormously. It can mean the shock was small. Or it can mean the shock was real and the market took it without seizing. Gas is the cleanest place to see the difference, because Europe has now been hit twice.
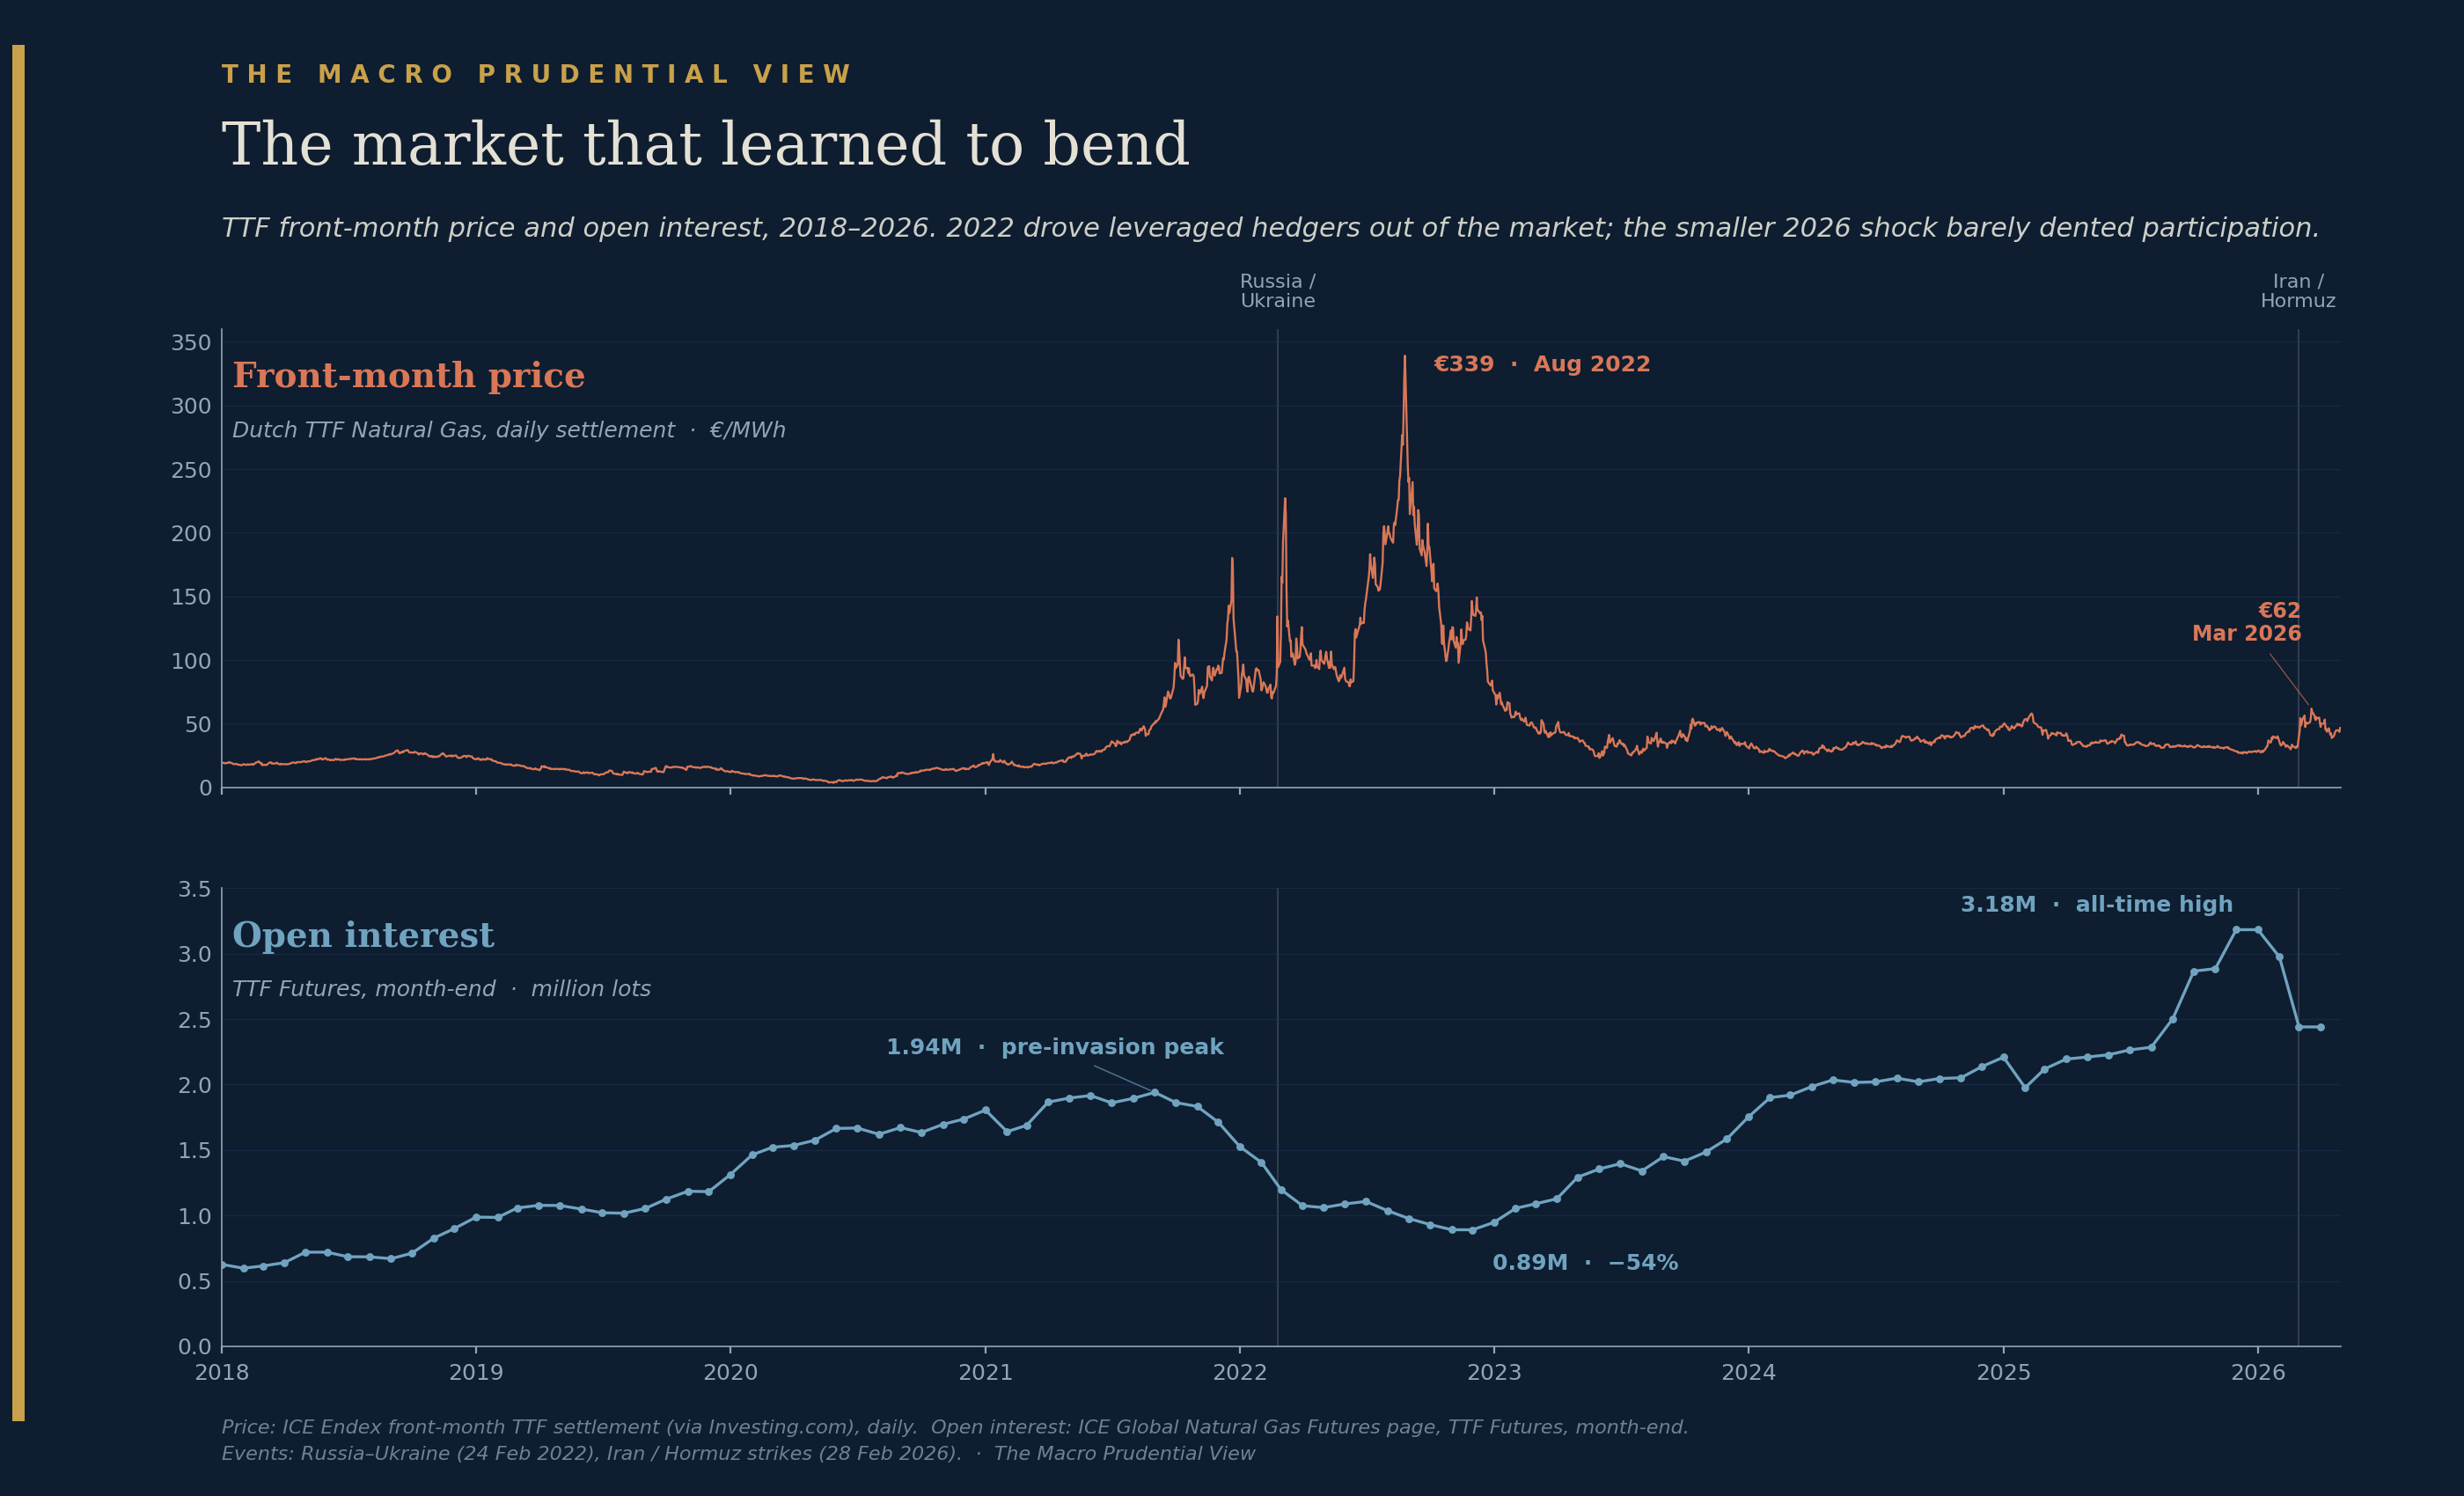
The chart above tracks the Dutch TTF gas benchmark — front-month price on top, open interest (the number of outstanding futures contracts, a proxy for how many participants are actually in the market) below. In 2022, the price reached €339 per megawatt-hour, and open interest collapsed — falling 54% from its pre-invasion peak to its trough. This is what a participation crisis looks like: as prices and margin requirements spiralled, leveraged hedgers could no longer fund their positions and were forced out of the market precisely when hedging was most valuable. The market didn’t just get expensive; it got thin, shedding the very participants who give it depth.
By February 2026, gas prices roughly doubled on the Iran/Hormuz shock — a sharp move, peaking near €62. But look at the open interest. It barely flinched. Participation fell only about 23% from what was, by then, an all-time high — a high more than four times the 2022 trough. A larger relative price move, from a vastly higher base of participation, produced less than half the dislocation. The 2026 decline was an orderly de-risking from a record high, not a margin-driven exodus. The market bent. In 2022, it had broken.
I think this is the single most important contrast in the whole picture, and it generalises. The question is never simply “how big was the shock?” It is “did the shock force participants out of the market, or did they choose to step back and then return?” The first is dysfunction. The second is resilience. And the difference between them lives in the plumbing — in margin, in clearing, in who is obligated to keep providing liquidity when it stops being profitable to do so. This is not a parochial commodities concern: when a margin spiral forces hedgers out of a cleared futures market, the strain runs straight through the clearing house to its members, and a commodity dislocation becomes a systemic one — which is precisely the channel the gilt crisis exposed in a different market months later.
Where the dysfunction lived
If resilience lives in the plumbing, it is worth asking where, exactly, the 2022 dysfunction concentrated — because the answer turns out to complicate the obvious “European energy crisis” reading.
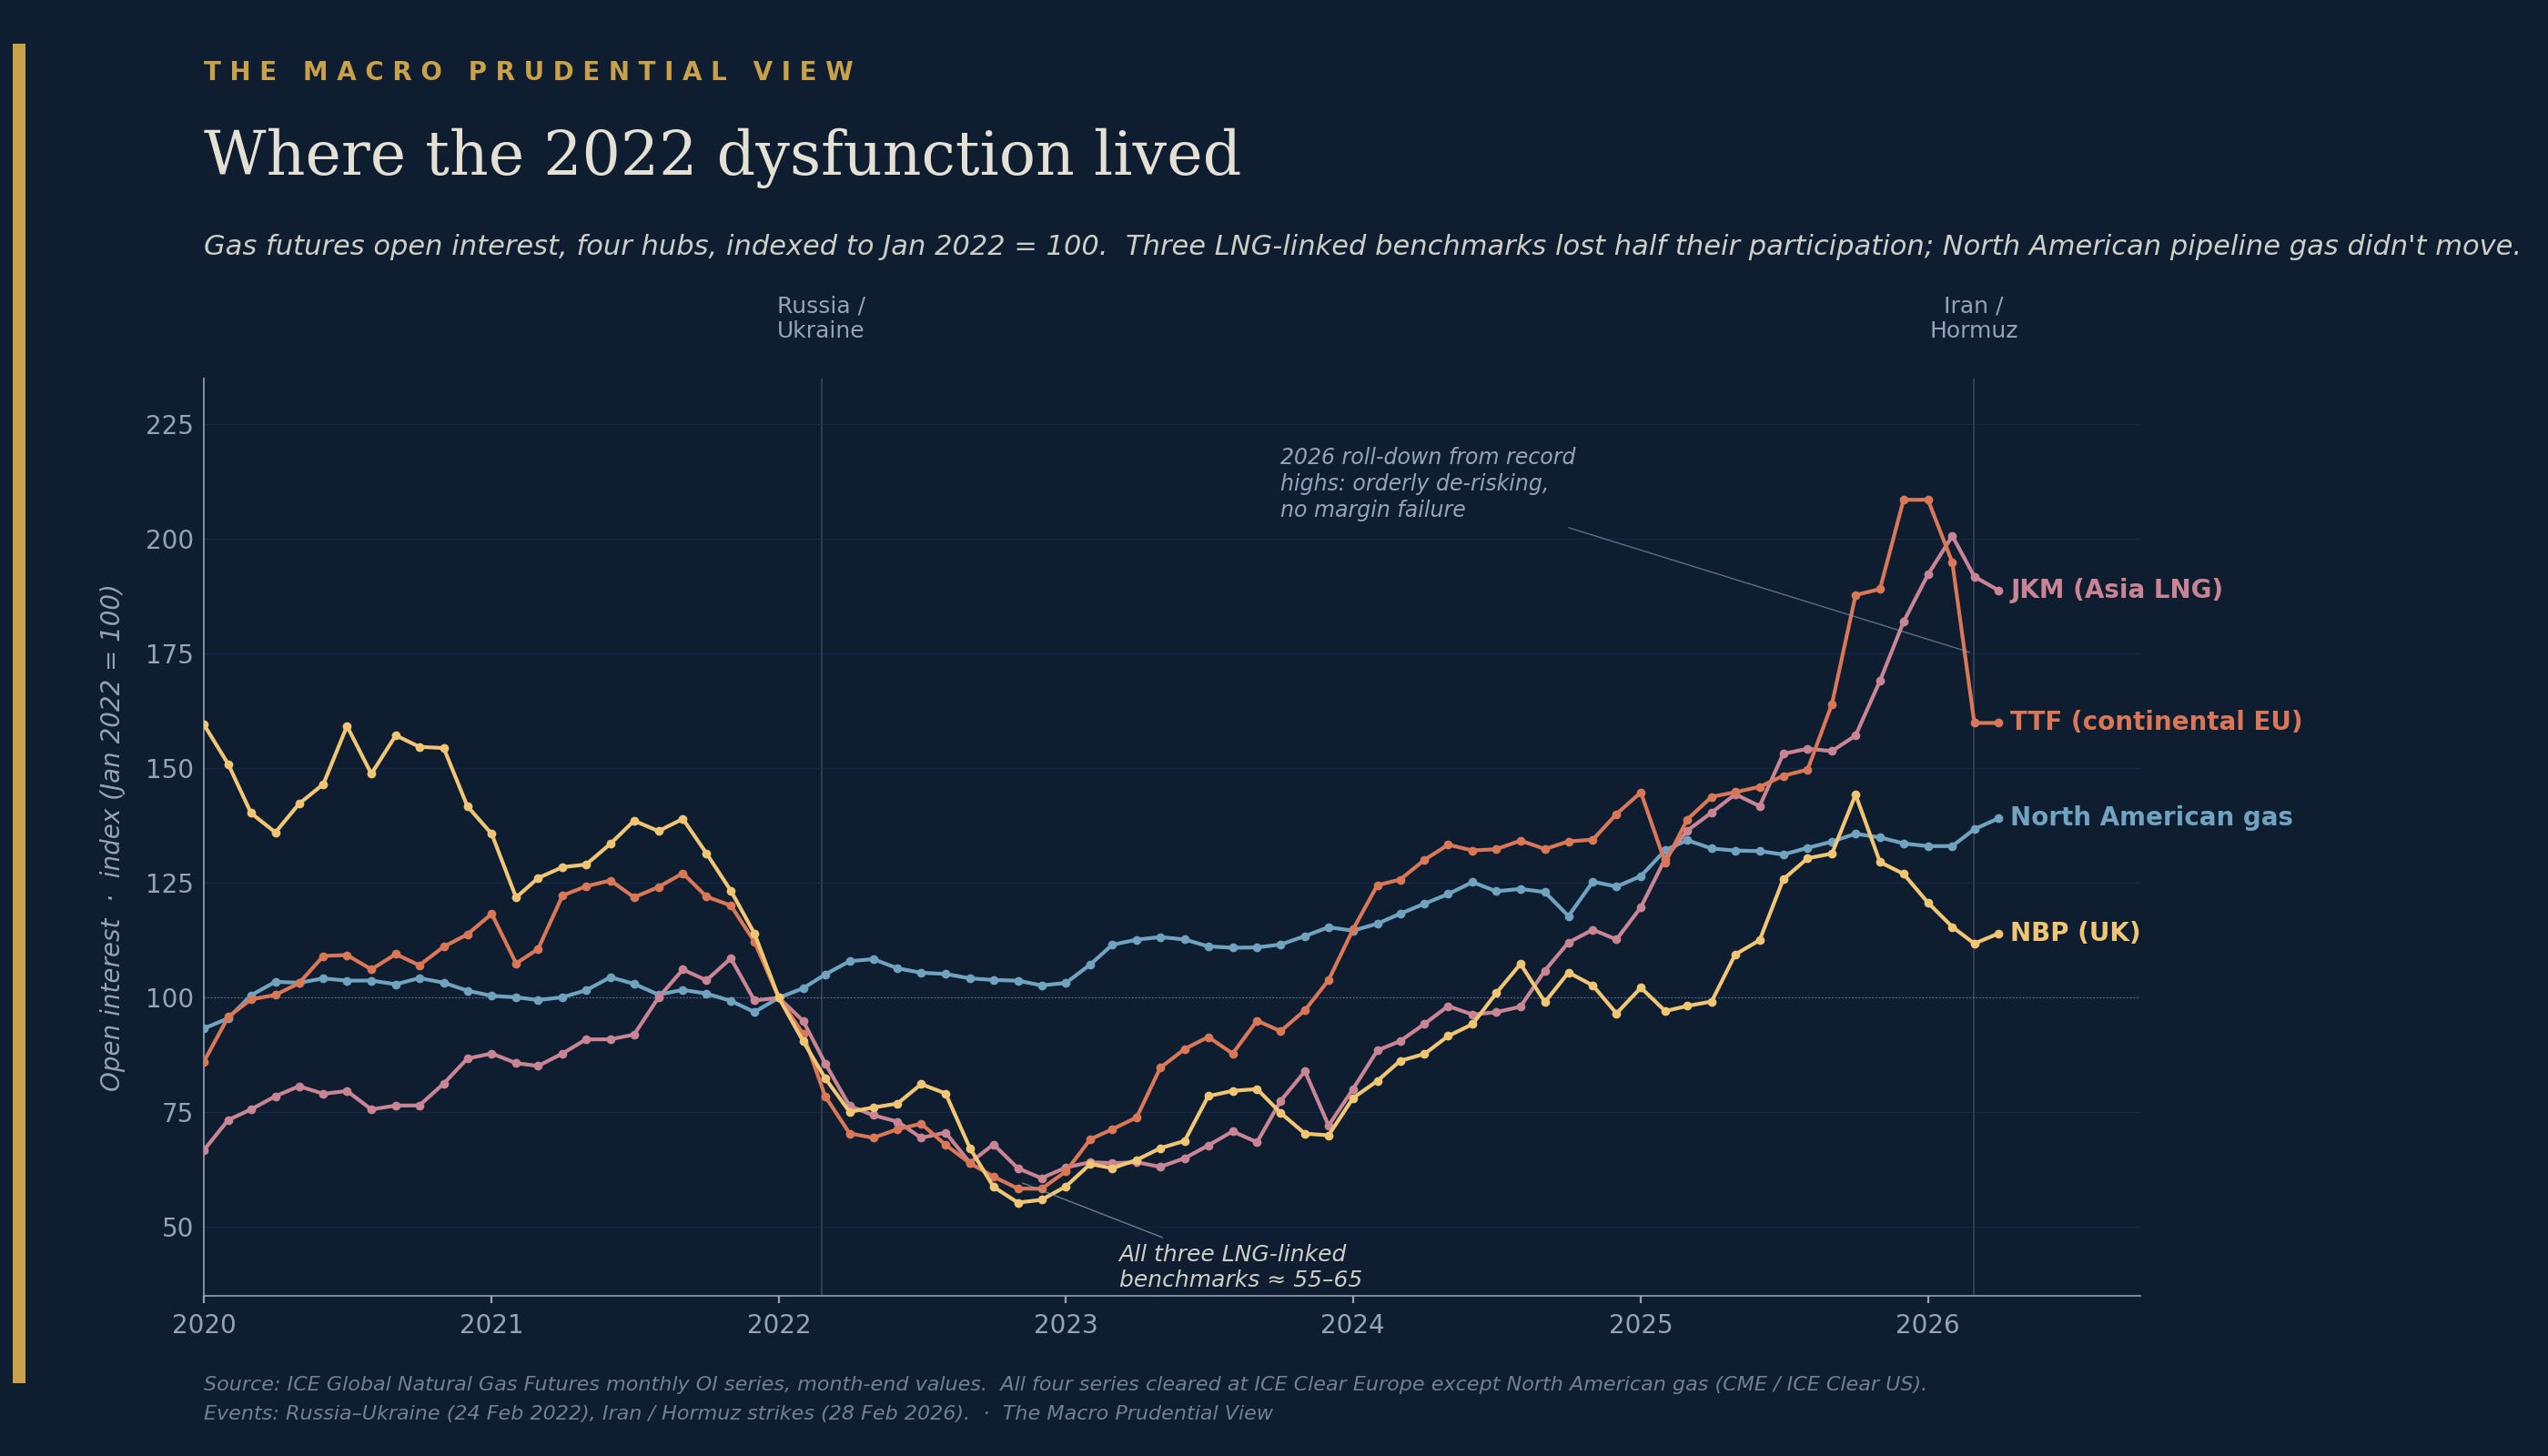
The chart above indexes open interest across four gas benchmarks to January 2022. Three of them collapsed together through 2022: the Dutch TTF (continental Europe), the UK’s NBP, and — crucially — Asia’s JKM. The fourth, North American gas, did not move. It sat flat through the entire period while the other three lost between 44% and 60% of their participation.
The obvious story — that this was a European energy crisis — does not survive that fourth line. JKM is an Asian benchmark; if the dysfunction were geographic, it should not have collapsed in lockstep with the European hubs. What the three falling benchmarks share is not geography. It is that they are the LNG-linked contracts, traded by a globally mobile set of participants — utilities, commodity trading houses, LNG portfolio players — who hedge across all of them at once. When a price and margin spiral in one drained the collateral those participants had available, it drained their capacity to hold positions in the others. North American pipeline gas, with its different and more domestic participant base, was insulated.
There is a further pattern worth flagging, though I want to be careful not to overclaim it. The three benchmarks that collapsed all clear at the same central counterparty — ICE Clear Europe — while North American gas clears elsewhere. That is consistent with a story in which procyclical margin models at a shared clearing house amplified the contraction across all the products it cleared. But it is also consistent with the simpler explanation that these markets just share participants. The data here cannot separate the two, and I would treat the clearing overlap as an intriguing pattern that deserves investigation rather than a settled mechanism. Either way, the lesson is the same: the dysfunction respected the boundaries of participants and plumbing, and ignored national ones — which is exactly why a venue-by-venue regulatory perimeter can miss it.
Two kinds of liquidity
We can now name the thing the comforting story gets wrong. It assumes that the liquidity you see in calm markets is the liquidity you will have in a crisis. It is not.
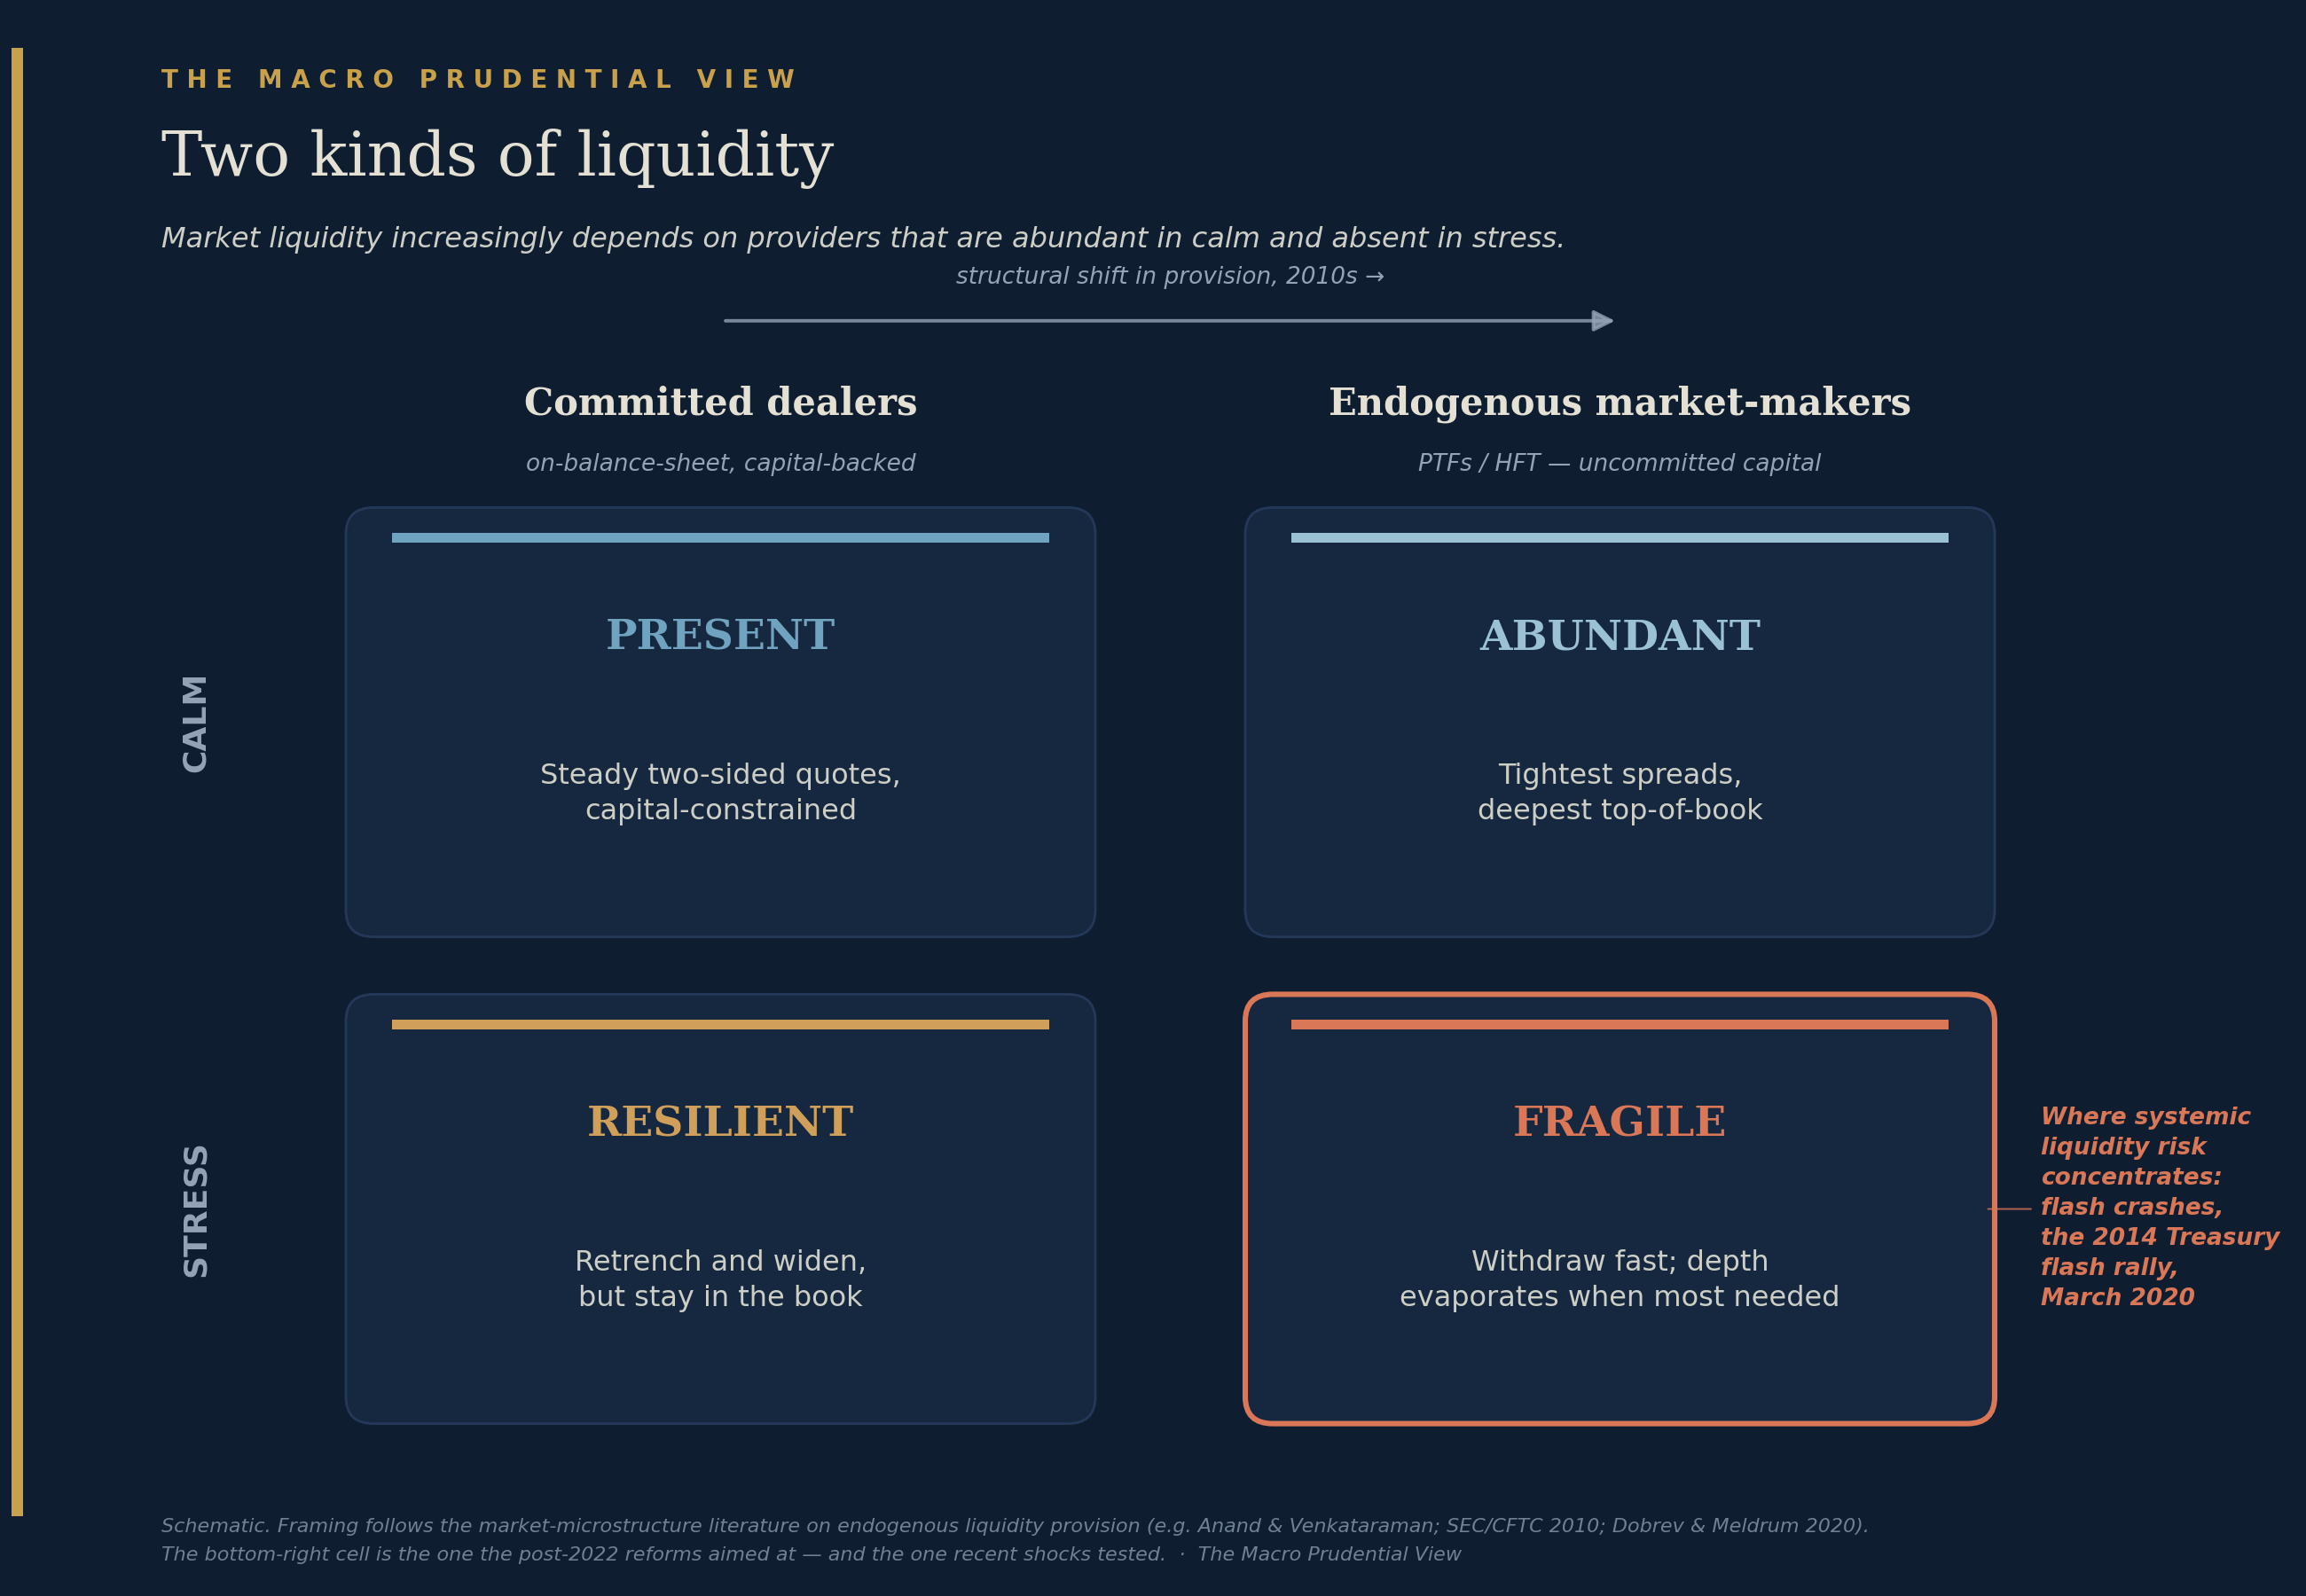
There are, roughly, two kinds of people providing liquidity in a modern market. The first are committed dealers — banks, intermediating on their own balance sheets, backed by capital and bound by obligation and regulation. In calm markets they are present but capital-constrained; they do not provide the tightest prices. In stress they retrench and widen their quotes, but they stay in the book. They degrade gracefully.
The second are what the microstructure literature calls endogenous market-makers — the principal trading firms and high-frequency market-makers whose capital is uncommitted. In calm markets they are abundant: they provide the tightest spreads and the deepest top-of-book, and they are the reason trading has never looked cheaper or smoother. But their capital is uncommitted by definition. In stress, they withdraw — fast — and the depth that looked so reassuring evaporates exactly when it is needed. This is the cell where systemic liquidity risk concentrates: the flash crashes, the 2014 Treasury flash rally, the dash-for-cash of March 2020.
The structural shift over the last fifteen years has been toward the second kind of provider. Markets in calm conditions are deeper and cheaper than they have ever been precisely because uncommitted, fast, electronic capital dominates the order book. But that same shift means that the liquidity is more fragile in stress — more of it can simply leave. The machines did not make markets robust. They made calm-state liquidity abundant and stress-state liquidity flightier. Those are not the same thing, and macroprudential policy cares about the second one.
So what absorbed the last three shocks?
The tectonics underneath
If it was not the microstructure — if anything, the microstructure got more fragile — then the resilience has to have come from somewhere else. The honest answer is that it came from the slow, unglamorous accumulation of reforms layered on top of that fragile microstructure, compensating for it.
I want to resist the temptation to crown a single reform as the cause, because the evidence does not support it and the truth is almost certainly a composite. But the strongest candidates are visible. Central counterparties have been pushed toward less procyclical margin models, so that a price spike is less likely to trigger the kind of self-reinforcing margin call that drove hedgers out of gas in 2022. The gilt crisis prompted liquidity-buffer requirements for liability-driven investment funds, so that the specific doom loop of 2022 is harder to set off. And the Federal Reserve’s Standing Repo Facility — established in 2021 as a backstop for funding markets — has quietly matured into a more usable tool, with daily morning operations added in June 2025 and, by December 2025, its aggregate cap removed in favour of full allotment. It is telling that the facility was actually used — it lent over $10 billion in a single day at the end of June 2025, its largest draw since inception — quietly, without drama, which is rather the point. A backstop that works at the routine, technical level is one that may never need to be deployed at the dramatic level.
These are the shifting tectonic plates of the regulatory landscape, not a single silver bullet. And not all of the adjustment was regulatory: some of it was behavioural. The desks that lived through the margin spirals of 2022 and the funding scramble of 2020 now manage collateral and position-sizing differently, whether or not a rule required them to — institutional memory is itself a buffer, if a perishable one. But one prominent reform is conspicuously not yet among the formal causes: the SEC’s Treasury central-clearing mandate, which will require central clearing of cash Treasuries from the end of 2026 and repo from mid-2027, has not yet taken effect. Whatever resilience we have seen in 2024–2026, it cannot be credited to a rule that is still prospective. That matters, because it means the most significant structural reform to the largest market in the world is still ahead of us — and untested.
The test that hasn’t come
Here is where I have to be honest about the limits of the argument, because the temptation to over-read three quiet shocks is strong and the cost of giving in to it is high.
The three shocks that were absorbed without intervention — yen carry, Liberation Day, Iran/Hormuz — were all, fundamentally, the repricing shocks I flagged at the outset. Asset prices moved violently as the market digested new information about tariffs, rates, or geopolitical risk. They were not funding shocks. Nobody’s collateral became unfundable; no clearing member faced a margin call it could not meet; the repo market did not seize. The dysfunction of 2020 and the gilt spiral of 2022 were different in kind: they were crises of funding and collateral, where the problem was not the level of prices but the inability to finance positions at any price.
The reforms I have described are aimed precisely at funding and collateral fragility — at margin procyclicality, at liquidity buffers, at the availability of a funding backstop. But they have not yet been tested by the kind of shock they were designed to withstand. A repricing shock that the market takes in stride is encouraging. It is not proof that the next funding shock will be absorbed the way the last three repricing shocks were. The true test of the reinforced plumbing is a stress that hits the plumbing directly, and we have not had one since the reforms went in.
So the cleaner reading of the evidence is this. Markets did not become resilient because the machines learned to provide liquidity in a crisis — they did not, and the structural shift toward uncommitted liquidity provision means the order book is in some ways more fragile than before. Markets coped because a decade of dysfunction produced a slow accumulation of reforms that compensated for that fragility, and because the recent shocks happened to be of the type those reforms address. That is a real achievement, and the people who built those reforms deserve more credit than the algorithms are getting. But it is a conditional achievement, resting on a structure of buffers that has to hold, and on a particular kind of shock continuing to be the kind we get.
The market learned to bend. Whether it has learned not to break, we will only find out when something pushes on the part that bent last time.
Paweł Fiedor — The Macro Prudential View
The views expressed are the author’s own and do not necessarily reflect those of any institution with which the author is or has been affiliated.
Sources: SEC & CFTC, Findings Regarding the Market Events of May 6, 2010 — https://www.sec.gov/news/studies/2010/marketevents-report.pdf; Joint Staff Report, The U.S. Treasury Market on October 15, 2014 — https://home.treasury.gov/system/files/276/joint-staff-report-the-us-treasury-market-on-10-15-2014.pdf; Federal Reserve, FOMC statement of 23 March 2020 — https://www.federalreserve.gov/newsevents/pressreleases/monetary20200323a.htm; Office of Financial Research, The London Metal Exchange Nickel Market Crisis (WP 24-09) — https://www.financialresearch.gov/working-papers/files/OFRwp-24-09_central-clearing-and-trade-cancellation.pdf; Bank of England, gilt market operation announcement, 28 September 2022 — https://www.bankofengland.co.uk/news/2022/september/bank-of-england-announces-gilt-market-operation; Swiss National Bank, Credit Suisse liquidity assistance statement, 19 March 2023 — https://www.snb.ch/en/mmr/reference/pre_20230319/source/pre_20230319.en.pdf; Bank of Japan, Deputy Governor Uchida speech, 7 August 2024 — https://www.boj.or.jp/en/about/press/koen_2024/ko240807a1.htm; Federal Reserve, FOMC statement of 19 March 2025 (QT taper) — https://www.federalreserve.gov/newsevents/pressreleases/monetary20250319a.htm; Federal Reserve, FOMC statement of 29 October 2025 (end of runoff) — https://www.federalreserve.gov/newsevents/pressreleases/monetary20251029a.htm; Federal Reserve Bank of New York, Standing Repo Facility operating policy, 28 May 2025 and 10 December 2025 — https://www.newyorkfed.org/markets/opolicy/operating_policy_250528 and https://www.newyorkfed.org/markets/opolicy/operating_policy_251210; U.S. Securities and Exchange Commission, Treasury Clearing implementation — https://www.sec.gov/securities-topics/treasury-clearing; Bank of England, Financial Stability Report, July 2023 (LDI) — https://www.bankofengland.co.uk/financial-stability-report/2023/july-2023. Volatility data: CBOE (VIX), ICE BofA (MOVE), Qontigo/STOXX (VSTOXX). Gas price and open-interest data: ICE Endex (TTF) via Investing.com; ICE Global Natural Gas Futures (TTF, NBP, JKM, North American hubs). Fed balance-sheet data: Federal Reserve H.4.1 via FRED (TREAST). CUSIP breadth: Federal Reserve Bank of New York, Outright Purchases and Sales of Treasury Securities.