



The May 2026 Financial Stability Review contains a box that anyone worried about equity valuations should read. Its subject is euro-area investors’ exposure to highly valued markets — US technology and AI above all. Cyclically adjusted price/earnings ratios sit well above their own history, US indices well above European ones. Euro-area investors have quadrupled their holdings of US equities over the past decade while only doubling their total equity book, and the fund sector is the single largest holder of both. By the ECB’s own decomposition, roughly 70% of that rise came from valuation effects rather than fresh purchases, and currency moves contributed little. The box builds toward a now-standard worry: thin cash buffers, pockets of leverage, flows that reverse hardest in the most expensive segments, and second-round effects on household wealth and consumption as fund ownership reaches through insurance and pension wrappers.
I am not going to dispute any of that. The valuation read is sound and the transmission story is the right one. What I want to add is the question the supervisory lens leaves implicit — overvalued in what? — and then to follow one thread in the box’s own data, the currency the exposure is denominated in, a little further than the box does. The first runs through most of the piece. The second is where it lands.
A price is a number with a unit inside it
Most valuation arguments smuggle in a unit and a benchmark, then talk as if the result were absolute. CAPE, the measure in the box’s first chart, already does part of the cleaning: it averages real earnings over a decade, stripping inflation out of the denominator, so the FSR is not making the naive nominal-earnings mistake. But the numerator is still a price, and a price is denominated in something. For a euro-area investor that something is the euro. Change the unit, and the level moves.
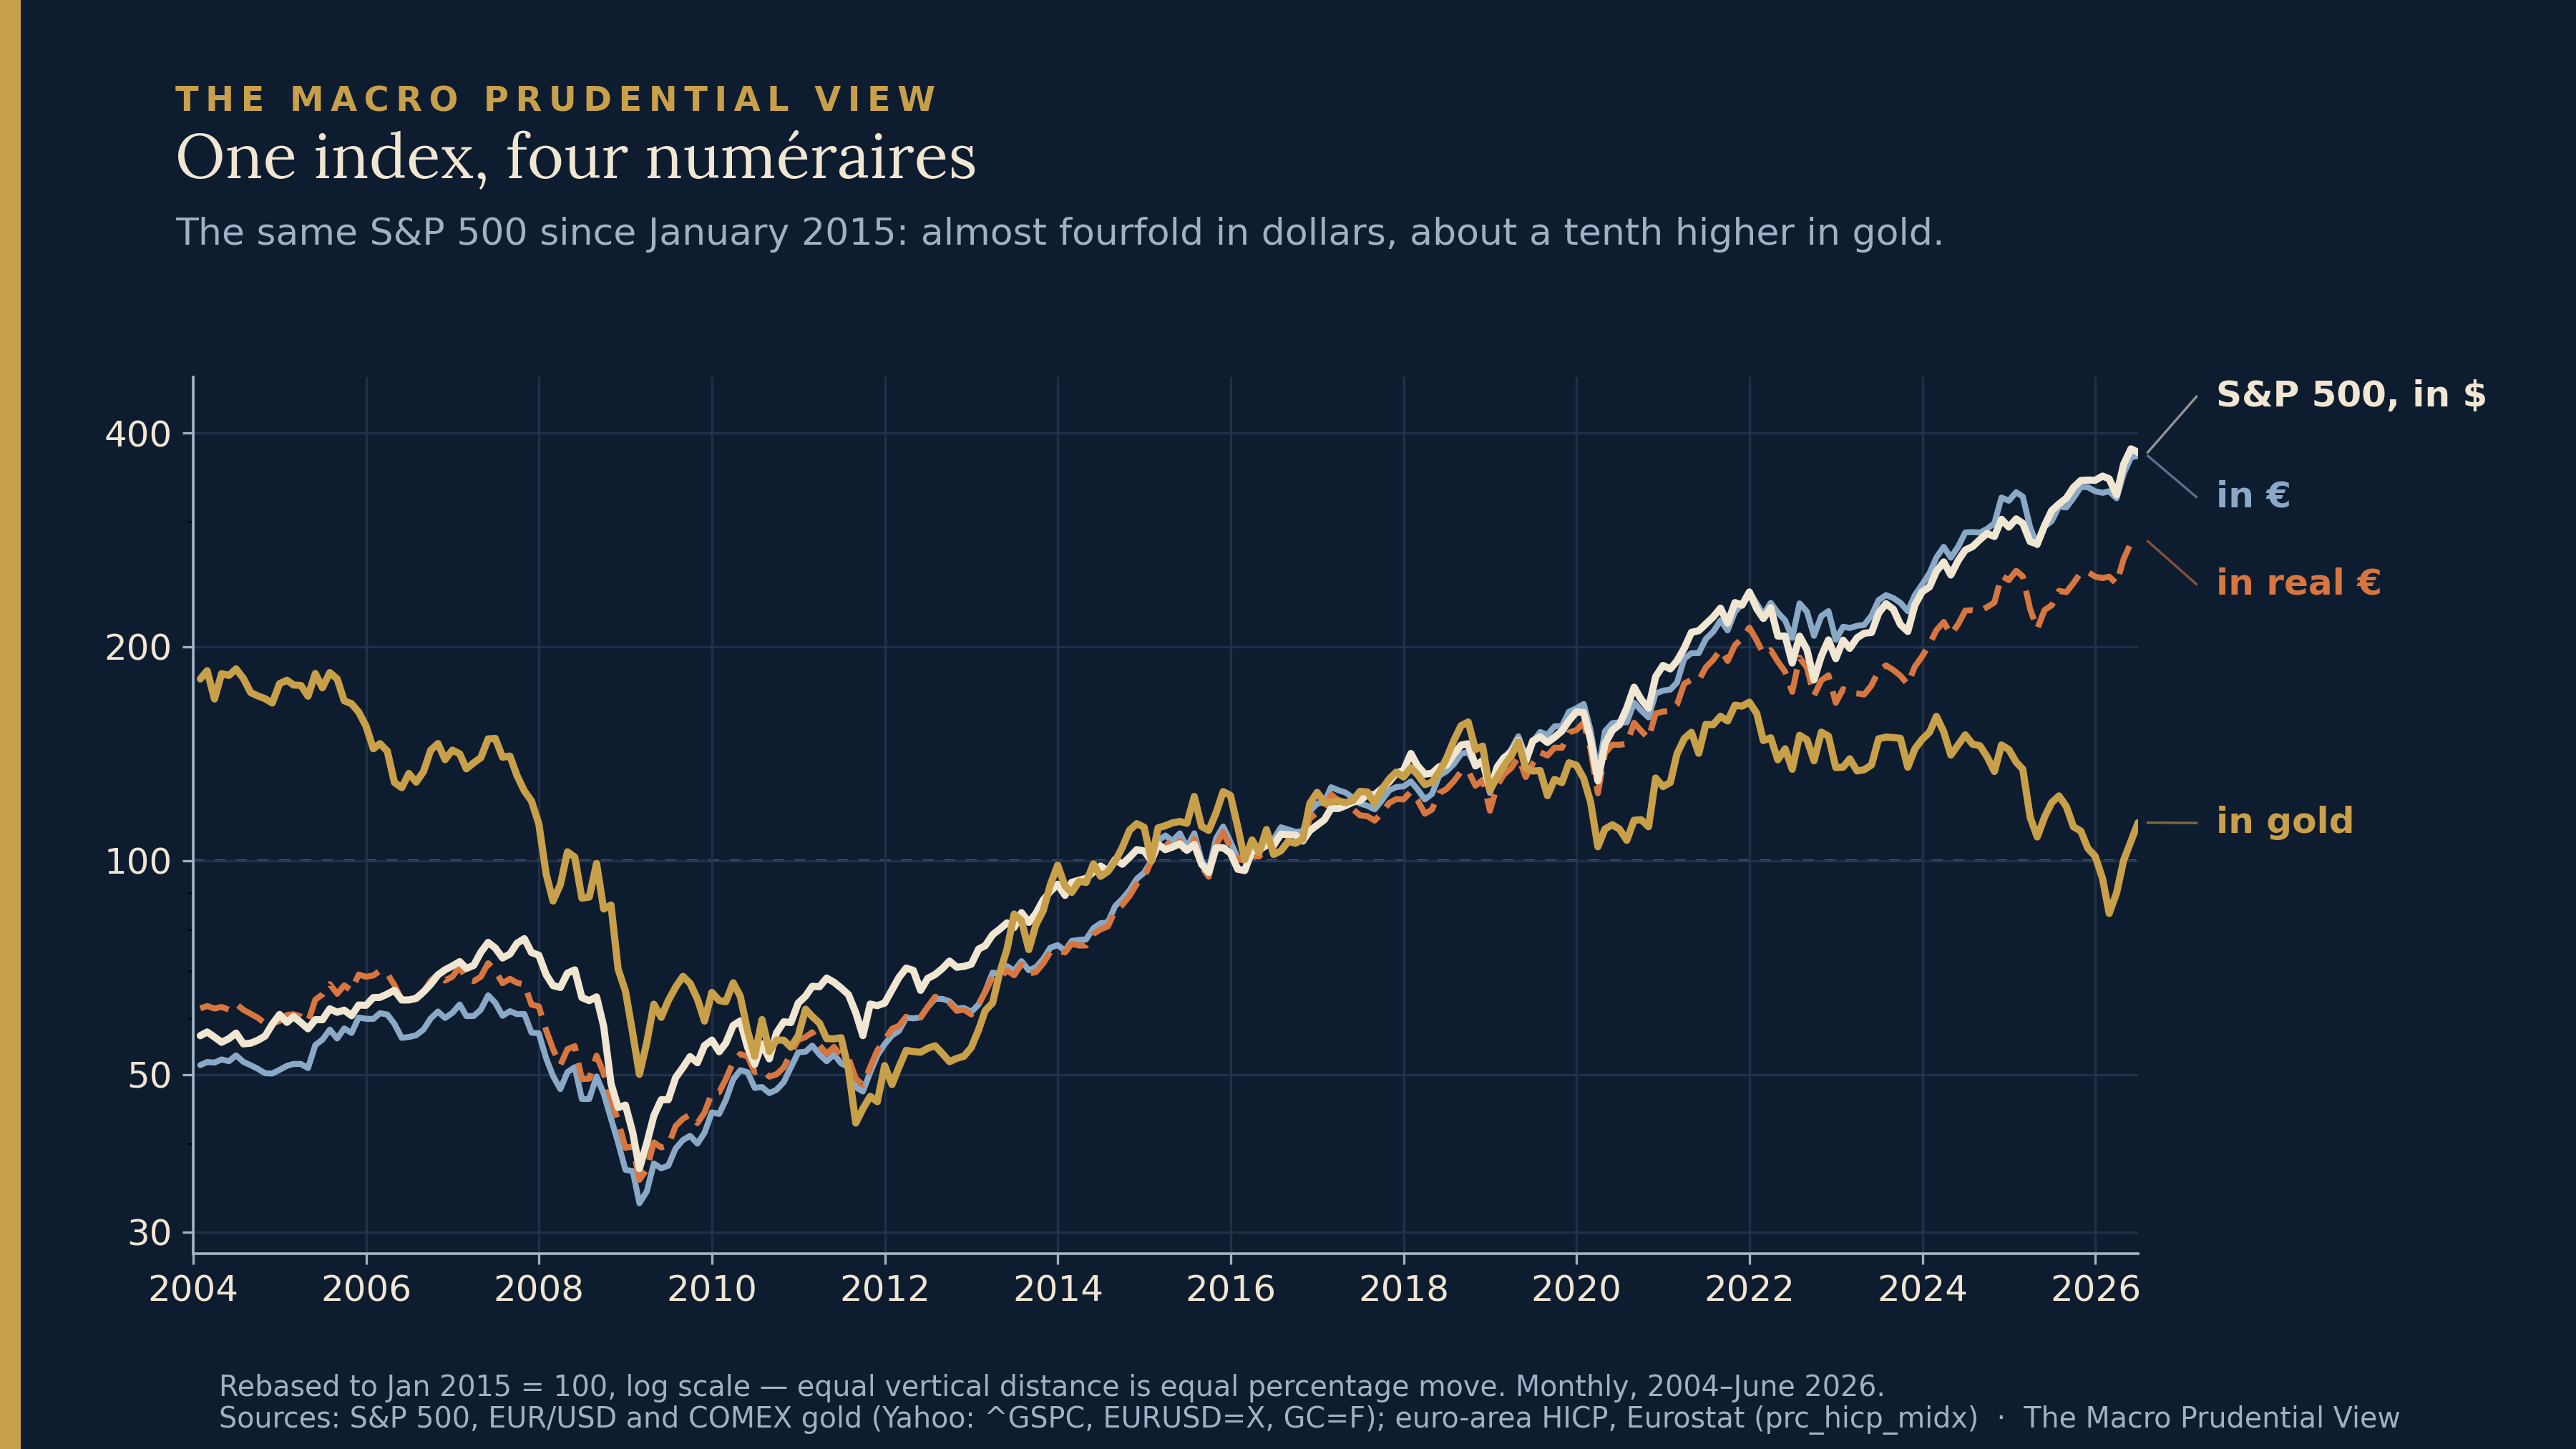
Here is the S&P 500 — the index those dollar holdings largely track — since January 2015, rebased to 100 and shown in four units. In dollars it is up almost fourfold. In euros, almost exactly the same: across the full decade the exchange rate did little of the work, which is the FSR’s own point. In inflation-adjusted euros it is up about 2.8 times. In gold it is up barely a tenth. The four lines are one price series; none is the index “really” doing what the others are not. No price series comes with a privileged measuring rod attached. A valuation is conditional on a unit — and, the practitioner will add, on a benchmark, a liability structure, and a horizon. Hold the liability structure; it returns at the end.
Note the small gap between the dollar and euro lines. Over ten years it nets to almost nothing, but it is not nothing within the decade: the euro investor ran ahead of the dollar number while the dollar was strong into 2022, then gave it back as the euro firmed. That gap is the exchange rate.
The unit does more than colour the read. How expensive the market looks — in the unit investors and risk managers actually use — can feed position sizing, leverage appetite, and crowding: a market that reads as merely full rather than extreme invites a larger book. On that view the numéraire-dependent read of “expensive” helps shape how much nominal claim gets built in the first place — the stock of leverage and fund assets the acute trigger later acts on. The box’s finding that flows reverse hardest in the most expensive segments is at least consistent with this kind of valuation-sensitive crowding, even if it is evidence about the unwind rather than direct proof of how the position was sized.
The risk premium, measured two ways
The textbook version of the units problem is older than the debate. Modigliani and Cohn argued in 1979 that investors discount real cash flows at nominal rates and misprice the difference; its everyday descendant is comparing an equity earnings yield to a nominal bond yield — subtracting a nominal number from a real one and calling the gap a premium.
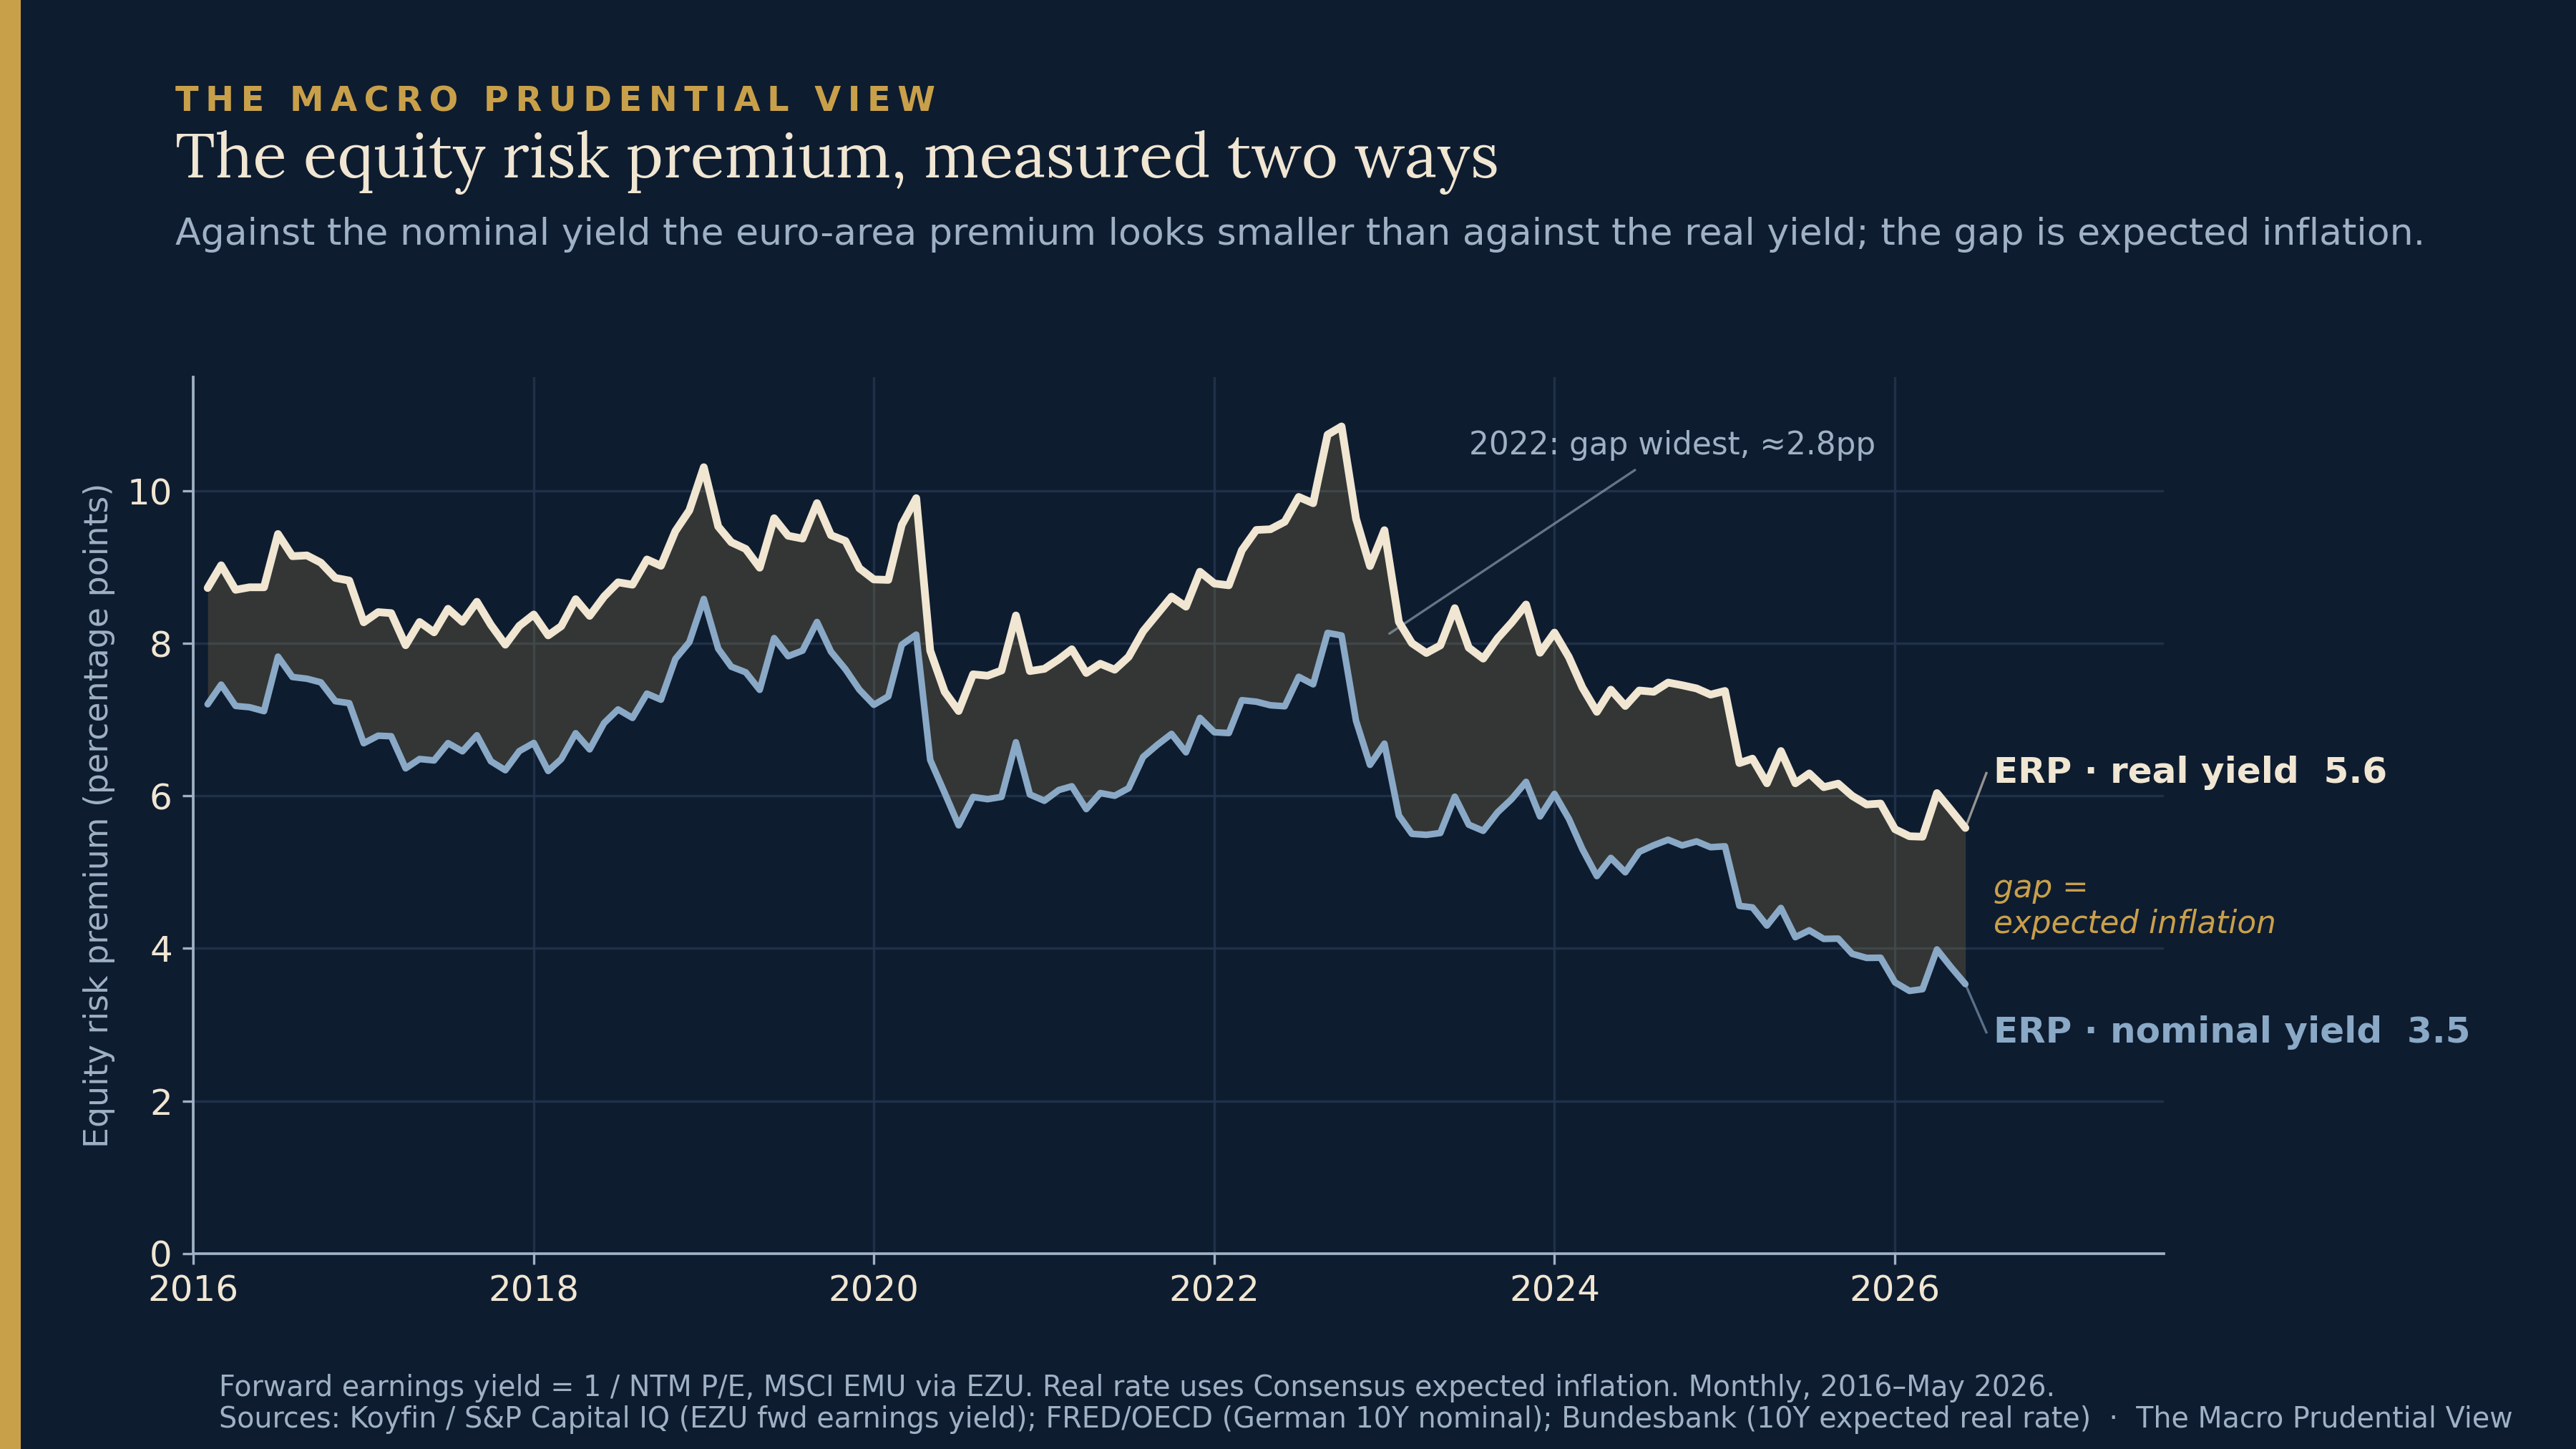
Compute the euro-area equity risk premium against the nominal ten-year and against the real ten-year, and the difference between the two readings is, by construction, expected inflation: about 2.8 points at the end of 2022, a little above two now. It is the same lesson as the first chart in a different metric — “stocks look expensive relative to bonds” turns on which yield you put on the other side.
Is some unit better?
If the unit is a choice, the natural reach is for a stable one, and it usually ends at gold. The data ends the reach quickly.
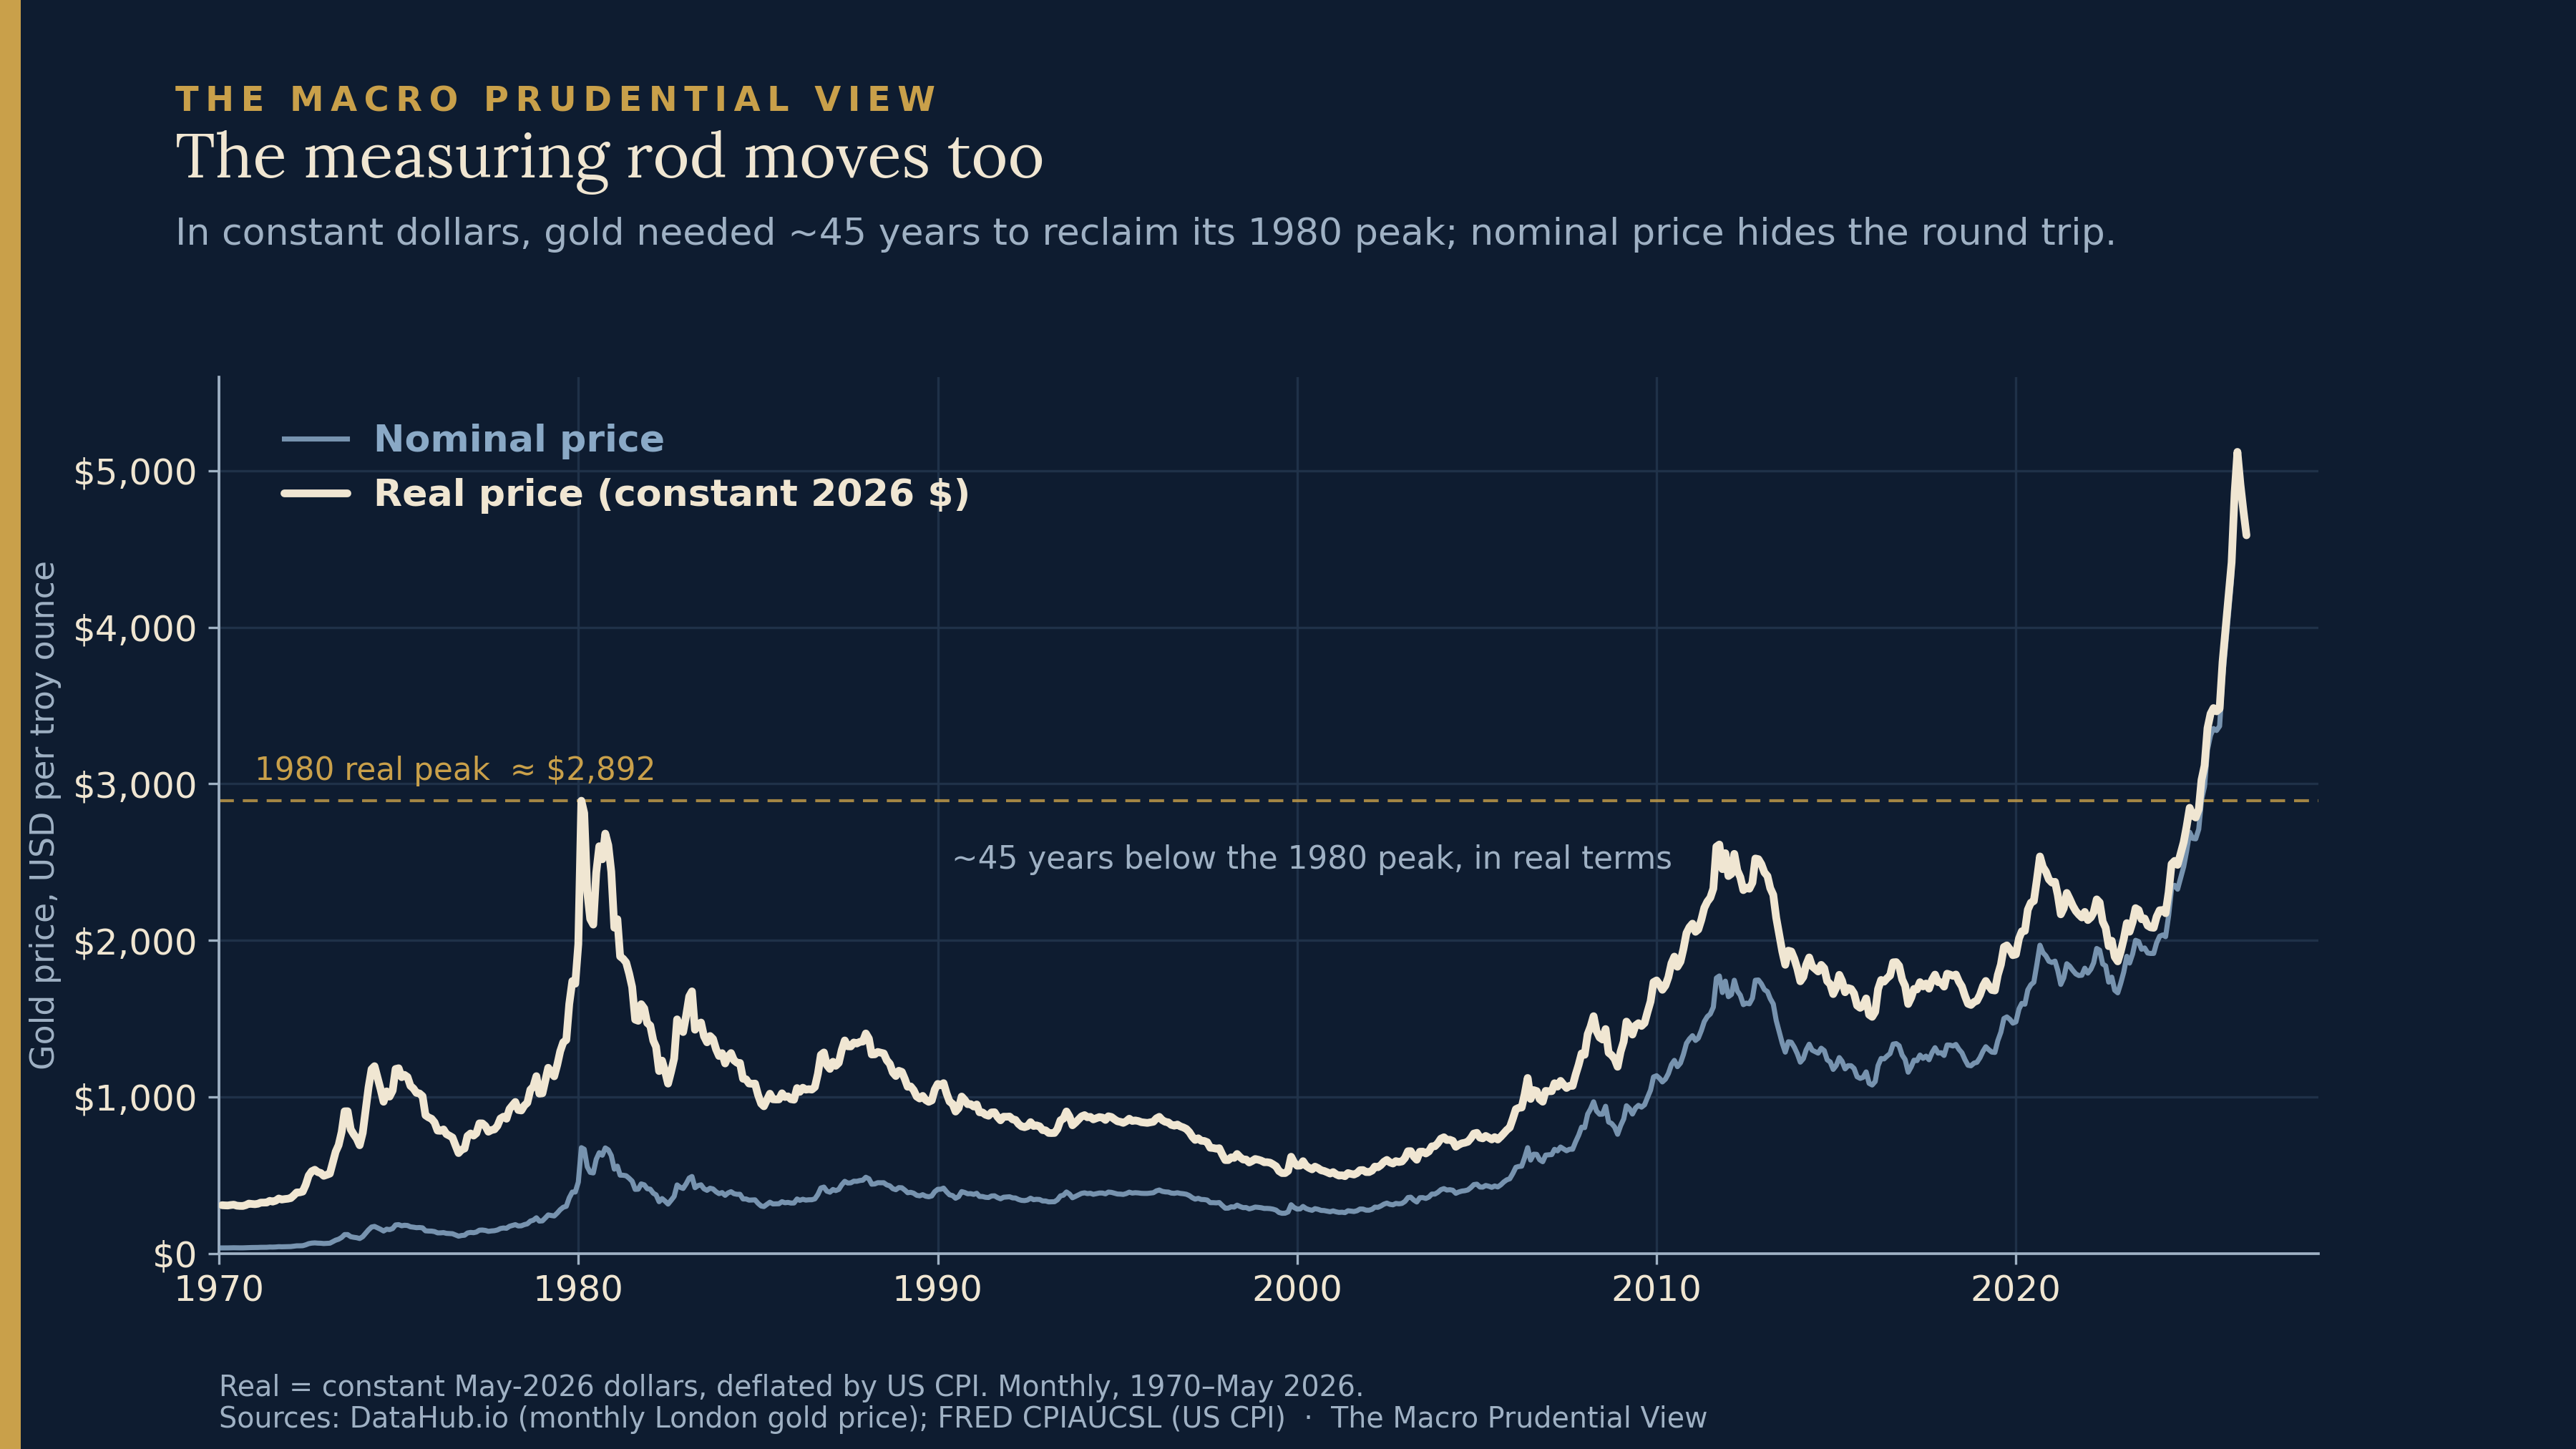
In constant dollars, gold’s January 1980 peak was not durably regained for forty-five years: the nominal price cleared the old high in 2006, but in real terms not until early 2025. A rod that loses much of its real value and needs a generation and a half to recover is no steadier than the currencies it is meant to discipline. The distinction is between a valid unit and a stable one — gold is a perfectly good thing to quote a price in, and its own instability is exactly why switching to it moves the reading. “Cheap in gold” is not firmer measurement, only measurement against a rod that happens to be long right now.
What actually binds
So far this is a piece about measurement, and measurement is a problem for the valuation debate. Whether it is a problem for stability needs the build-up and the trigger held apart.
The build-up metrics are unit-sensitive, in both senses above: the read is conditional on a rod, and the read helps size the position. The acute trigger usually is not. A fund meets redemptions in euros; a margin call is denominated in euros; leverage is a nominal liability the borrower cannot reprice when repricing would help. The dash-for-cash of March 2020 and the 2022 gilt/LDI episode were nominal liquidity spirals, and neither turned on the correct numéraire. So the unit critique bites hardest where nothing acutely binds — what a portfolio is worth, whether an index is dear, how rich a household feels — and barely touches the nominal plumbing that does the forcing.
The clearest place the measuring rod can become part of the margin call is the cross-currency balance sheet, and it is the one the box’s own holdings data draws. A euro fund holding the dollar index has euro liabilities and dollar assets. Redemptions and margin fall due in euros; the assets sold to meet them are priced in dollars. In the calm build-up this is, exactly as the box found, a currency footnote — FX did little. In stress, whether the currency leg helps or hurts depends on the kind of stress. In a classic flight-to-quality the dollar is the haven: it rises as risk assets fall, and for the euro holder the stronger dollar cushions the euro value of the loss. The mismatch bites in the other regime — a dollar-confidence shock, where US assets and the dollar fall together. There the euro fund is hit twice, the asset drawdown and a falling dollar widening the euro loss at the same moment redemptions and margin come due in euros. The numéraire, a footnote in the build-up, becomes the exposure in precisely the stress that is about the unit itself. That state-contingent flip is what the title names.
How far this binds is conditional, and the conditions are what separate it from a generic point about currency mismatch. It binds to the extent the currency exposure is left open rather than hedged; to the extent margin and redemptions fall in the home currency while the assets do not; and to the extent collateral or liquidity transformation leaves the fund short the currency of its liabilities when it most needs it. A fully hedged book with home-currency collateral does not have this problem. An imperfectly hedged one, meeting euro redemptions out of dollar assets under a hedge that itself calls variation margin in stress, does. The seam is specific enough to locate in a given fund’s book.
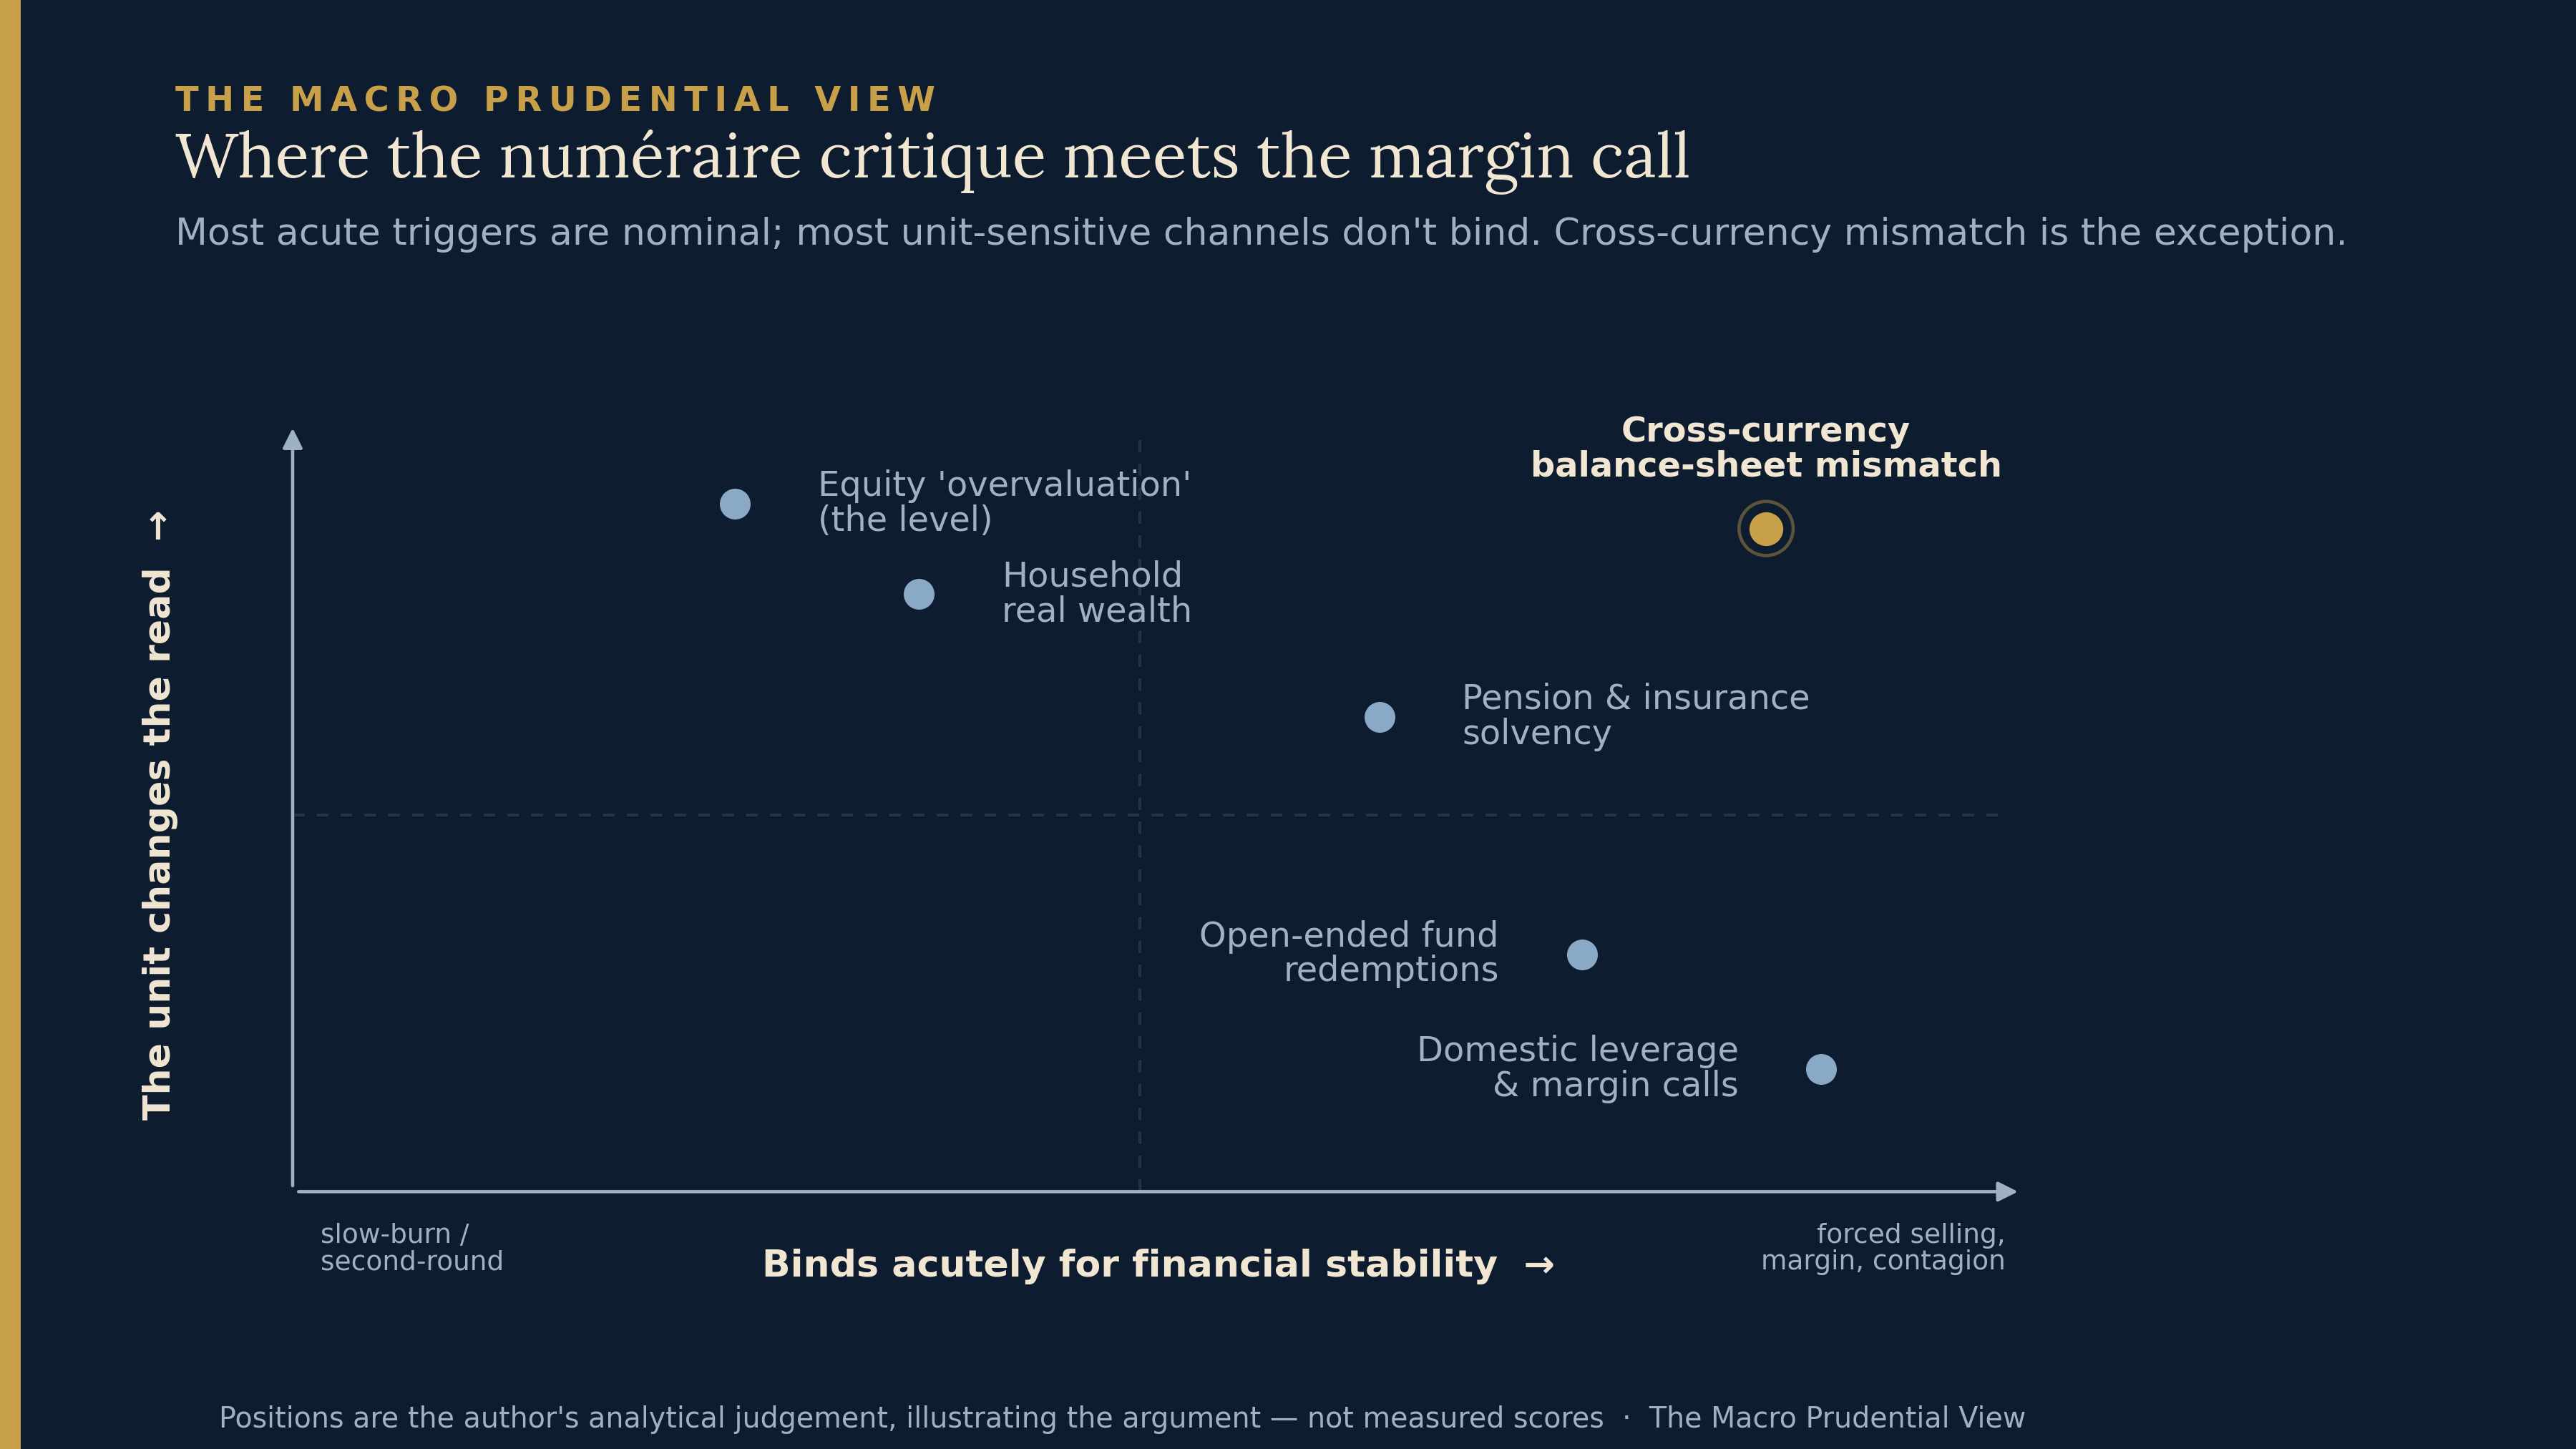
The map is analytical judgement, not measurement, and is drawn that way. Two questions: does the unit critique change the reading, and does the channel bind acutely? The acute, unit-invariant triggers sit bottom-right — domestic leverage and margin, open-ended fund redemptions. The unit-sensitive items that mostly do not acutely bind sit top-left — equity “overvaluation” as a level, household real wealth — though the level is not a pure non-binder, since, as above, the unit-dependent read may scale the exposure that later does. Cross-currency balance-sheet mismatch sits top-right, the one place both hold at once. Pension and insurance solvency sits between: real or inflation-linked liabilities make nominal-versus-real change the economic-solvency read, and while the channel is slower and better buffered than an FX margin call, a joint inflation-and-FX stress — the scenario where the unit matters most — can move it rightward toward binding faster than the baseline suggests.
The gap, named without a remedy
There is a blind spot here worth naming without pretending to close it. EU fund liquidity stress testing, under the ESMA guidelines in force since 2020, requires managers to stress both assets and liabilities — redemptions above all — and is deliberately principles-based: the manager selects the risk factors the fund’s profile warrants. Asset-side liquidity is the natural focus — how fast holdings can be sold, and at what haircut. The currency-translation leg sits at the seam between market-risk and liquidity-risk testing: a euro fund’s dollar assets, sold into euro redemptions with the exchange rate moving inside the same stress, is a cross-risk interaction that can be under-weighted in practice, especially where the FX hedges themselves call collateral at the wrong moment. Whether a given manager models it is left to the firm. “FX did little in the build-up” — the box’s finding — and “FX does little in stress” are different claims, and the distance between them is the blind spot.
The box ends on household second-round effects — wealth, consumption, the real economy — and that is the right place to end, because it is unit-dependent in just the way this argument has been. A wealth effect is a change in what a portfolio is worth, and worth is denominated in something; the consumption response runs on real purchasing power, a numéraire-sensitive quantity and a slow one. That is why the household channel sits where it does on the map — the rod matters, and it binds gradually if at all. The thing that forces the selling, when selling is forced, is in euros. The clearest place the rod can become part of the margin call is the cross-currency balance sheet the box’s own data describes, under conditions specific enough to look for. Whether it matters in the next cycle I don’t know. It is the part of the map I would watch.
Paweł Fiedor — The Macro Prudential View
The views expressed are the author’s own and do not necessarily reflect those of the Central Bank of Ireland, the European Systemic Risk Board, the Eurosystem, or any other institution with which the author is or has been affiliated.
Sources: European Central Bank, Financial Stability Review, May 2026, box “Drivers of investor behaviour in highly valued equity markets” (Baudino, Bosio, Dieckelmann, Kaufmann and Puga) — https://www.ecb.europa.eu/press/financial-stability-publications/fsr/focus/2026/html/ecb.fsrbox202605_04~fd7b91dd22.en.html; S&P 500, EUR/USD and COMEX gold front-month, Yahoo Finance (^GSPC, EURUSD=X, GC=F); euro-area HICP, Eurostat (prc_hicp_midx) — https://ec.europa.eu/eurostat; forward earnings yield from the NTM price/earnings ratio of the iShares MSCI EMU ETF (EZU), Koyfin / S&P Capital IQ consensus; German ten-year nominal yield, FRED / OECD (IRLTLT01DEM156N) — https://fred.stlouisfed.org; German ten-year expected real rate, Deutsche Bundesbank (BBSEI.M.ERZ.GVB.DE._Z.R10XX) — https://www.bundesbank.de; long-run monthly gold price, DataHub.io — https://datahub.io; US consumer prices, FRED (CPIAUCSL); ESMA, Guidelines on liquidity stress testing in UCITS and AIFs (ESMA34-39-882), in force 30 September 2020 — https://www.esma.europa.eu/document/guidelines-liquidity-stress-testing-in-ucits-and-aifs; F. Modigliani and R. Cohn, “Inflation, Rational Valuation and the Market,” Financial Analysts Journal (1979); J. Y. Campbell and T. Vuolteenaho, “Inflation Illusion and Stock Prices,” American Economic Review (2004). Chart data as cited in each figure.