



Last month gave us a live demonstration of the mechanism this article is about.
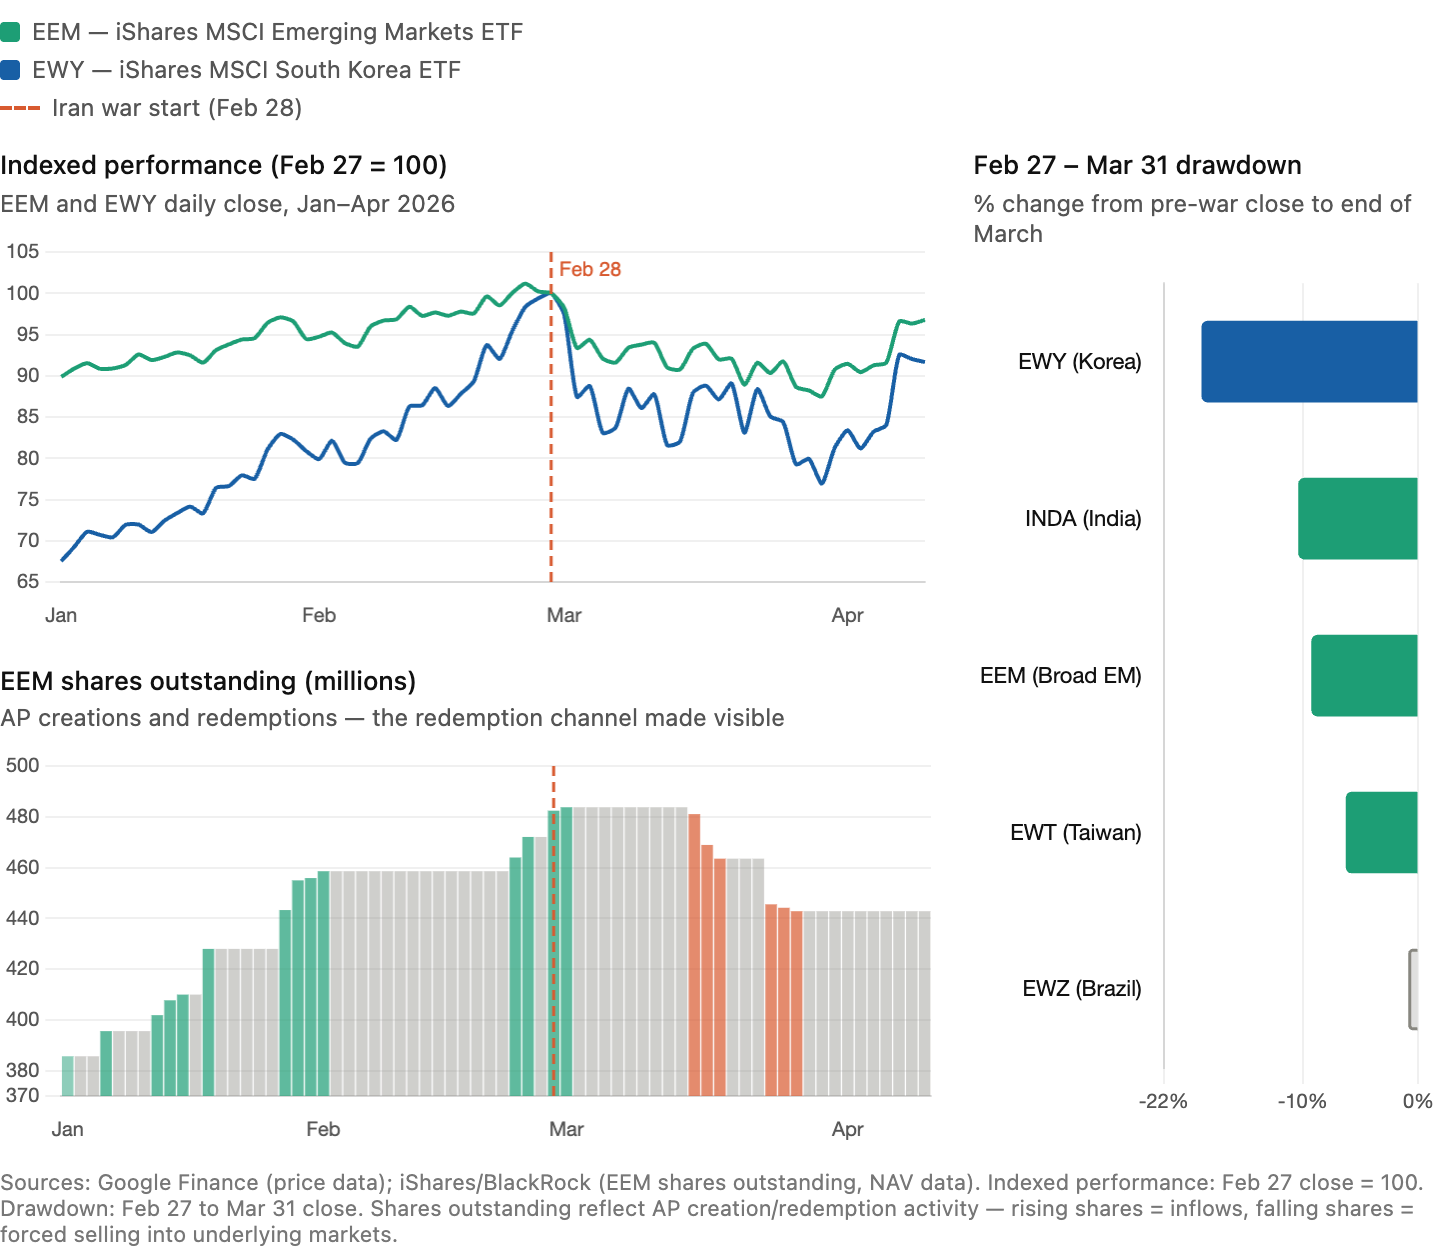
When the Iran war began on February 28 (following US-Israeli strikes on Iran), foreign investors pulled $70.3 billion from emerging markets in a single month — the largest outflow since the pandemic rout of March 2020, according to IIF data reported by Reuters. The chart above shows what that looked like at the ETF level across three panels.
The top-left panel tells the price story. South Korea fell nearly 19% from its pre-war close to end of March. The broad EM index fell 9%. Brazil barely moved. The Korea vs Brazil contrast reflects something real about the shock itself — Asian tech manufacturing hubs are heavily dependent on Middle East oil imports, which makes them acutely vulnerable to an energy price spike. That is a genuine fundamental difference. But the speed, synchronicity and scale of the selling also reflected a market structure in which passive vehicles mechanically offload the same benchmark names at the same time. Every broad EM ETF holds the same Korea overweight. When the exit began, it was simultaneous across thousands of funds sharing identical index weights. Bloomberg reported that INDA and EWT — both in the drawdown panel — suffered record monthly redemptions of $1.4 billion and $1.1 billion respectively in March, confirming that price declines were accompanied by large-scale AP (Authorised Participant) redemptions into the underlying markets.
The lower-left panel adds something the price chart cannot show: the redemption channel made visible. It tracks EEM (iShares MSCI Emerging Markets ETF) shares outstanding — green bars are AP share creations, red bars are redemptions into the underlying market. Two things stand out. First, the inflow staircase in January and February: 98 million new EEM shares were created in nine weeks as risk appetite surged, representing roughly $5.8 billion of pre-war positioning in a single ETF. Second, and more important: prices fell sharply from March 2 but AP redemptions did not begin until March 16 — a full two weeks later. Once they started, 41 million shares were redeemed in eight trading days. The secondary market absorbed the initial selling through price decline. The structural forced selling came later, in a concentrated burst.
This two-week lag matters analytically. It means the price chart understates the eventual selling pressure — by the time AP redemptions activated, prices had already fallen and liquidity had already thinned. The redemptions then hit a market that was weaker than it had been when the first wave of selling began. That sequencing is not random. It is a feature of how the passive vehicle structure transmits stress, and it is what the rest of this article is about.
The IMF’s April 2026 Global Financial Stability Report Chapter 2, published this week, puts granular numbers on this dynamic across 50 emerging markets over two decades. And my own research explains the micro-mechanism that makes passive herding especially dangerous in debt markets — where the same logic produces not a visible, continuous selloff but a quiet accumulation of latent fragility that breaks suddenly under stress.
What the IMF found
Drawing on holdings data covering roughly 4,000 mutual funds and 7,000 institutional investors across 50 emerging markets, GFSR Chapter 2 documents something we suspected but could not previously quantify at this granularity. Since the global financial crisis, cumulative nonresident portfolio flows into emerging markets have approached $4 trillion, driven overwhelmingly by the nonbank financial sector. The NBFI share of EM portfolio debt liabilities has roughly doubled to 80% over two decades.
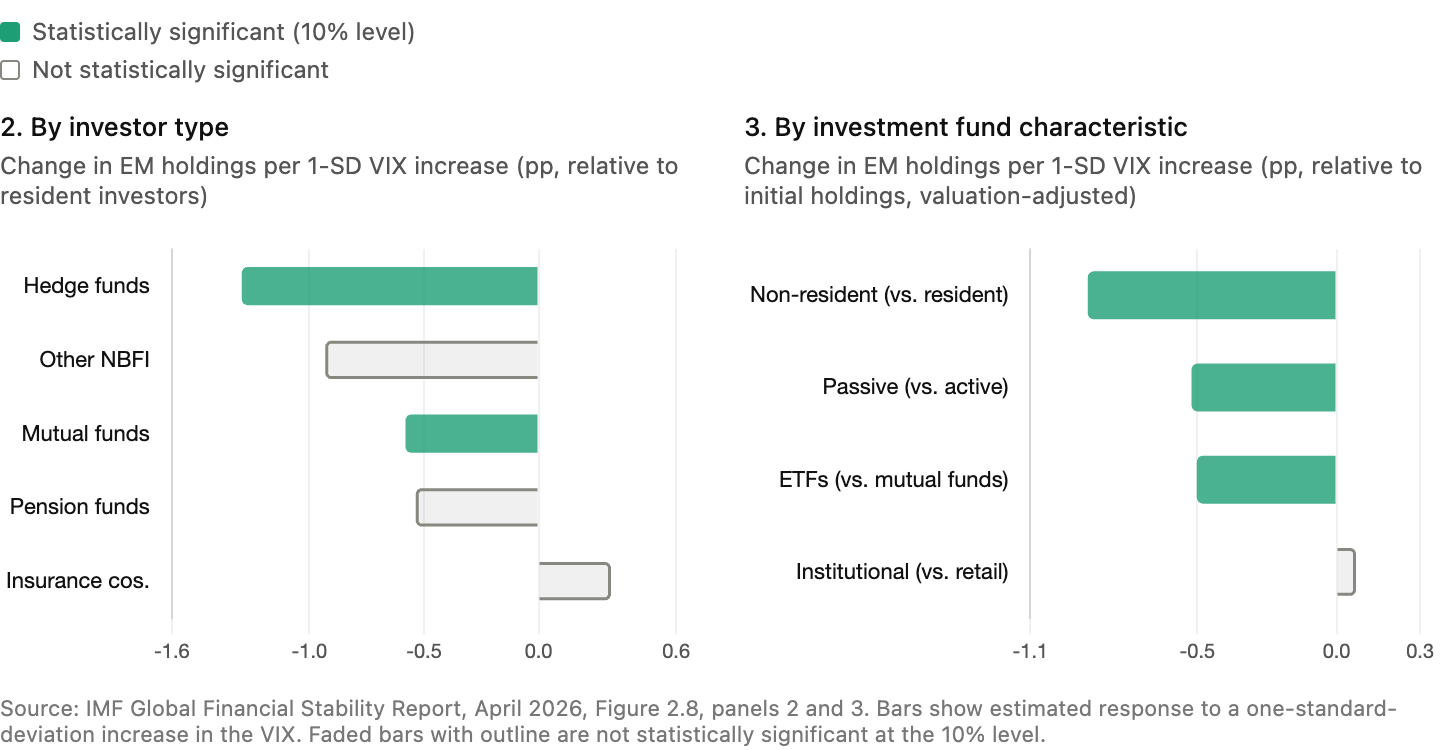
Within that universe, sensitivity to global risk varies sharply by investor type. Hedge funds are the most reactive, but passive mutual funds and ETFs are the most sensitive segment within the investment fund category — more so than active mutual funds, more so than pension funds or insurers. When global risk appetite deteriorates by one standard deviation in the VIX, passive funds and ETFs reduce their emerging market holdings significantly more than active funds. They are also more likely to pass investor redemptions directly through to underlying asset markets, given their limited flexibility to use cash buffers to absorb outflows.
The macrofinancial consequences are substantial. Countries whose debt markets rely most heavily on the flightiest investor quintile — defined by the GFSR as the top quintile of nonresident investors by VIX sensitivity, mainly hedge funds and passive vehicles — face a 28–45% decline in new debt issuance during stress episodes, spread widening of 30–120 basis points, and a 6 percentage point increase in downside GDP risk over the following quarter. These effects are persistent, remaining negative for up to four quarters on average, and are amplified for sovereigns with high debt ratios and firms with elevated leverage.
Figure 2.8 of the report makes this hierarchy crystal clear across two panels. Panel 2 shows that within the nonbank universe, hedge funds and mutual funds pull back most sharply from emerging markets when the VIX rises — insurers and pension funds show no significant adjustment. Panel 3 drills into investment funds specifically: passive strategies and ETFs display the largest additional sensitivity relative to their comparison groups, while the distinction between institutional and retail investors is not significant. The two panels together trace the mechanism from the broad NBFI universe down to the specific vehicle type — and the teal bars in the right panel are where the passive herding machine sits.
The accessibility channel: why passive herding works the way it does
The GFSR identifies passive funds and ETFs as the flightiest segment but does not spell out why their mechanics produce such powerful, synchronised behaviour. That requires looking at how ETFs actually transmit information and shocks to the securities they hold — and this is where the findings differ, in an instructive way, between equity and debt markets.
In research with Petros Katsoulis using the complete regulatory dataset of Irish-domiciled ETFs (€424 billion in AUM, roughly two-thirds of all euro-area ETF assets), we showed that ETFs form strong information links with underlying equities but weak ones with underlying corporate debt. The mechanism is arbitrage. When an ETF trades at a premium to its net asset value, Authorised Participants buy the underlying securities, deliver them to the ETF, and sell the newly created shares — creating a tight, continuous information channel between ETF prices and the prices of the underlying assets. But this only works when the arbitrage is cheap and fast to execute.
Exchange-traded equities satisfy this condition. OTC-traded corporate bonds do not. Search costs, transaction costs, and the post-crisis retreat of dealer market-making in corporate bond markets mean that APs face significant barriers to arbitraging ETF prices against the underlying bonds. The information link is therefore loose.
It is worth acknowledging that this accessibility asymmetry has real benefits in normal times. Passive vehicles have genuinely democratised access to EM assets, and the migration of liquidity traders to the ETF wrapper actually reduces cash bond market volatility when conditions are calm. The problem is what happens when the redemption channel activates under stress — which is where the normal-times stability becomes a liability rather than an asset.
The three panels below show all three dimensions simultaneously. A one-standard-deviation increase in ETF flows raises daily equity returns by 69 basis points but moves debt securities by only 0.4 basis points — a ratio of more than 170 to one. ETF illiquidity propagates to equity bid-ask spreads at 0.8 basis points; it has no measurable effect on debt spreads. Higher ETF ownership increases equity volatility — consistent with intensified arbitrage activity — but decreases debt volatility, because investors migrate to the more accessible ETF wrapper rather than transacting in the underlying bonds. The centre panel captures the return sensitivity contrast most vividly; the right panel’s sign reversal on volatility — positive for equities, negative for debt — is the single most important empirical result for what follows.
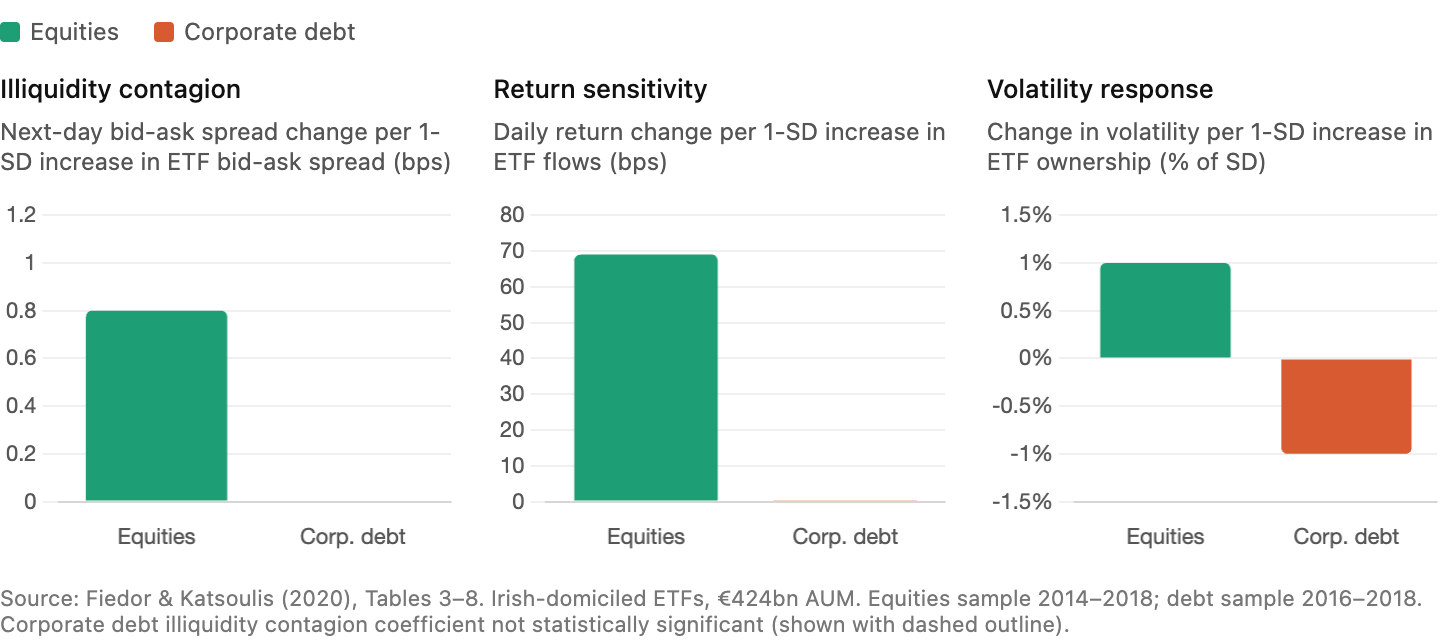
The sign reversal is not a curiosity. It is the mechanism.
The paradox: why weak links make debt more fragile, not less
Here is where the IMF’s macro findings and the micro-level evidence appear to point in opposite directions — and where working through that tension produces the most important insight. The matrix below maps the two transmission channels across the two asset classes. The bottom-right cell is where the IMF’s findings live, and it is coloured differently from the others for a reason.
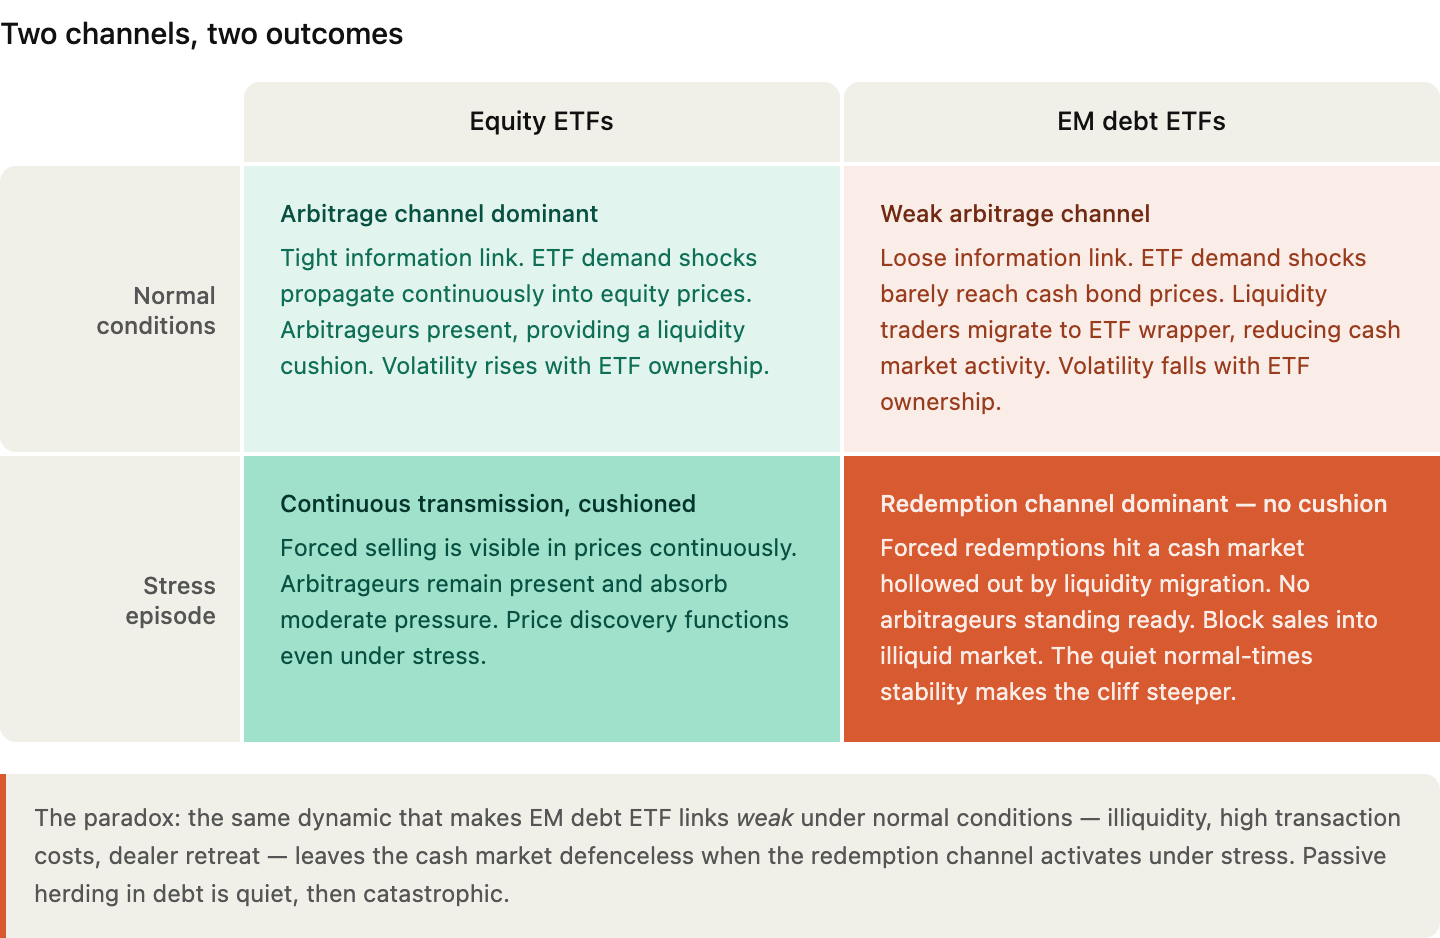
The answer to the apparent contradiction is that the two bodies of evidence are measuring entirely different channels. My paper captures the arbitrage-information channel. Because corporate bonds are hard to access, APs cannot efficiently arbitrage the ETF against the underlying, the information link is loose, and ETF demand shocks do not propagate strongly into bond prices. Liquidity-motivated investors migrate to the ETF wrapper rather than transacting in the cash market, which can actually reduce bond market volatility in normal times. This looks, from the outside, like stability.
The GFSR is measuring the redemption channel. When end investors redeem en masse from a passive EM debt ETF during a risk-off episode, APs must eventually sell the underlying bonds regardless of whether the information link is tight or loose. The weakness of the arbitrage mechanism does not prevent forced selling. It just means the selling arrives without prior price discovery — and lands on a cash market that has been structurally hollowed out by the very same liquidity migration that made the normal-times volatility so low.
This is the paradox the bottom-right cell of the matrix above captures: the dynamic that makes ETF-to-debt information links weak under normal conditions leaves the cash market defenceless when the redemption channel activates under stress. Passive herding in equity markets is loud and visible in prices at all times. Passive herding in EM debt is quiet — and then catastrophic. The low normal-times volatility that the accessibility channel produces is not a sign of stability. It is the cliff being made steeper.
Note also what March 2026 showed about debt vs equity. The IIF data recorded $56 billion in equity outflows — the largest in at least 20 years — but only $14 billion in debt outflows. That asymmetry is consistent with the accessibility argument: the redemption channel hit equities first and hardest because arbitrage links are tight and price transmission is immediate. Debt markets absorbed less visible but still significant outflows, with the transmission mechanism working more slowly and less transparently. The GFSR’s spread widening and issuance data capture what that looks like at the macro level over a full stress cycle rather than a single month.
What the GFSR adds on scale and structure
Beyond the investor-type decomposition, the GFSR documents two structural features that amplify the mechanism above. The first is the scale of the shift itself. The two panels below show the growth of passive and active EM fund allocations since 2006 across both debt and equity. Read the two panels together and note that the right-hand axes are identical — making the gap between them meaningful rather than a charting artefact. In debt, passive share has risen from under 2% in 2007 to around 33% today. In equity the shift has gone further still, with passive now approaching half of all EM equity investment fund allocation. That near-parity in the equity panel is the most striking single fact in the chart and most readers will not know it.
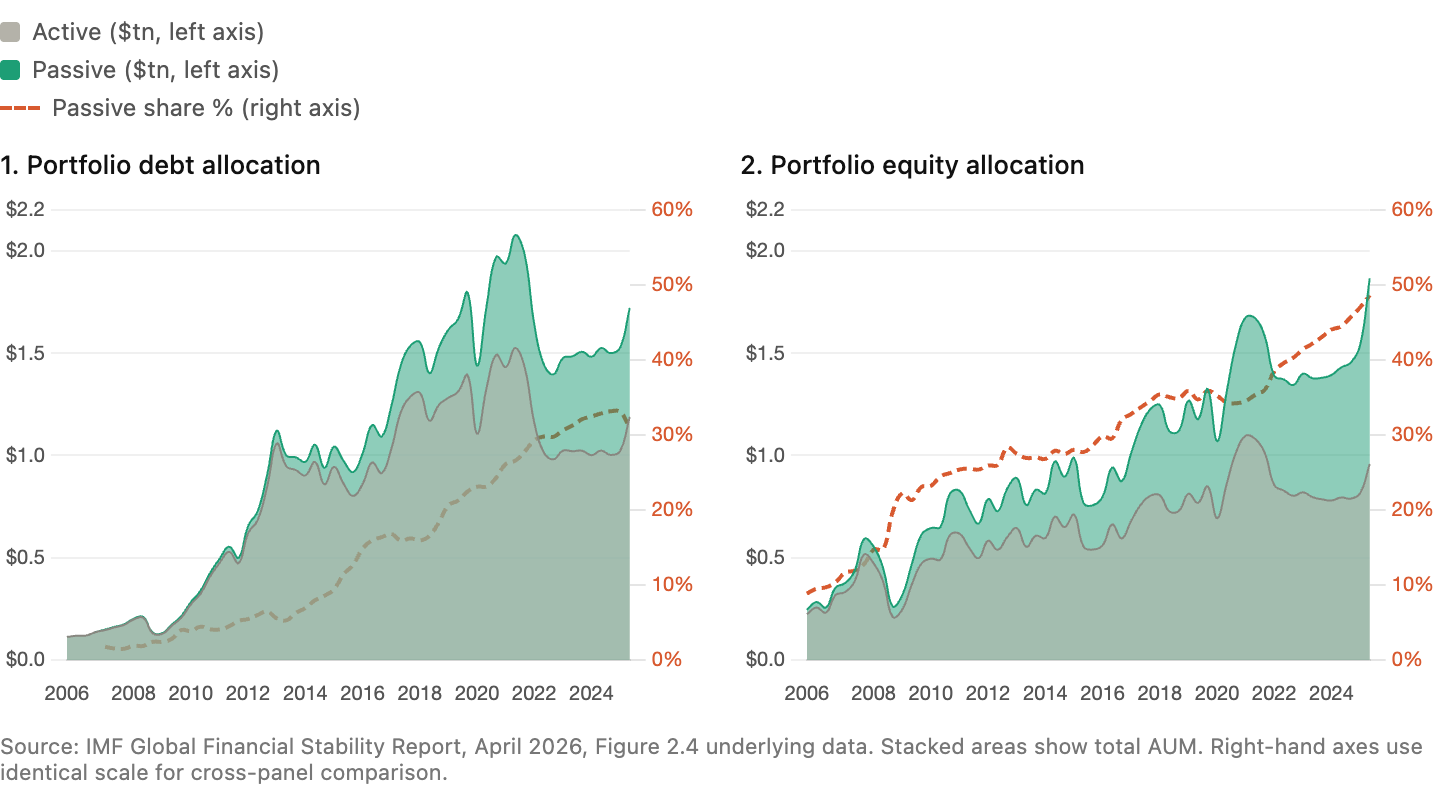
The second structural feature is that the passive share gain is not simply a story of more money flowing in — it reflects active AUM actually shrinking in recent years while passive held up. The total height of the stacked areas in the debt panel peaked around 2021 and has not recovered to that level, but within that flat total the teal band keeps growing. Passive is not riding a rising tide. It is taking share from active in a mature and in some respects contracting market. That dynamic is what makes the redemption channel risk cumulative rather than episodic.
The GFSR documents a third amplifying feature: country-level buffers matter. Nonbank investors pull back significantly less from countries with stronger institutional quality, higher reserve adequacy, and lower public debt ratios. This creates a troubling asymmetry — the countries most dependent on flighty investors for external financing are typically those with the weakest buffers to absorb their sudden departure.
This is not an emerging markets story alone — even core sovereign borrowers are not immune. KfW — one of the world’s safest borrowers, a AAA-rated German development bank — issued a €5bn 10-year EUR benchmark in January 2026 and generated a €50bn order book. Trading-oriented accounts and hedge funds accounted for 54% of that order book, up from 41% two years earlier. Banks, traditionally the anchor buyers in SSA syndications, fell from 42% to 27% over the same period. KfW Treasury posted the investor breakdown on LinkedIn this week and it is worth looking at directly.
Two caveats are worth stating plainly. First, order book share is not the same as allocation — KfW notes that central banks and official institutions led actual allocations at 38%, and that hedge funds typically receive thin or zero allocations despite their outsized order presence. Second, KfW is not an emerging market. But that is precisely the point. The KfW data documents the growing dominance of short-horizon, trading-oriented accounts in the price discovery process for even the safest fixed income instrument in Europe. These accounts are setting the clearing price on a €50bn book. The passivisation and financialisation of the marginal buyer is not a vulnerability confined to fragile EM borrowers — it has reached the core of the global fixed income market. Scale that dynamic to EM debt, remove the central bank backstop, and add the redemption channel — and you have the mechanism the GFSR is now documenting at macrofinancial scale.
Policy implications
The GFSR’s policy recommendations are appropriate as far as they go: strengthen macroeconomic fundamentals, build reserve buffers, implement liquidity management tools for open-end funds, improve NBFI data reporting, and expand international cooperation on cross-border exposures. These are necessary conditions.
The accessibility channel points to several more targeted additions. Fund-level liquidity mismatch reporting should go beyond asset class labels to capture the accessibility of the underlying basket — specifically, how easily Authorised Participants can arbitrage ETF prices against the underlying securities. A bond ETF holding liquid investment grade credit is fundamentally different in redemption risk profile from one holding illiquid EM corporate debt, even though both appear as fixed income in current reporting frameworks. Swing pricing and anti-dilution levies should be calibrated to the accessibility of the underlying basket — the bar should be meaningfully higher for fixed-income ETFs holding illiquid EM corporate debt than for equity ETFs where the arbitrage cushion exists. Stress-testing scenarios at both fund and system level should incorporate the redemption channel explicitly, modelling the scenario where normal-times low volatility in cash bond markets coexists with latent, large-scale forced selling capacity in the ETF wrapper above it.
Most practically: supervisors and central banks in recipient countries should track the passive share and ETF ownership concentration of their debt markets as early-warning indicators. A rising passive share compresses normal-times volatility while fattening the left tail. That asymmetry is precisely what growth-at-risk frameworks should be capturing.
The bottom line
Passive investing is not the spark. It is an amplifier — and last month's EM selloff showed that amplifier working in real time. The IMF has now quantified how powerful it has become at systemic scale. The micro-evidence from ETF markets explains why benchmark-driven selling amplifies so asymmetrically across asset classes: accessibility governs whether ETF demand shocks create continuous, self-correcting transmission or accumulate quietly into a latent redemption cliff.
The contagion web is being rewired. Understanding its topology requires both the macro map the IMF has now provided and the micro-foundation the accessibility channel supplies. Policymakers and supervisors who treat passive flows as a second-order issue are working from yesterday’s map.
Paweł Fiedor — The Macroprudential View