



The Eurosystem’s May 2026 report Strengthening the macroprudential lens in the regulation of non-bank financial intermediation proposes a familiar set of structural tools for retail open-ended fund liquidity risk: minimum holding periods, redemption notice periods, leverage caps. The analytical framing is forward-looking — what an EU-wide macroprudential framework for investment funds should look like. The empirical question is backward-looking: where has anything resembling this template been deployed before, and what happened?
The closest publicly observable analogue is Germany. The Kapitalanlagegesetzbuch (KAGB), in force from 22 July 2013, imposed a 24-month minimum holding period and a 12-month redemption notice on retail open-ended property funds (Publikumsfonds, or retail OEIFs — abbreviated Pub in the analysis below) but did not apply these restrictions to institutional open-ended property funds (Spezialfonds, abbreviated Spez). That asymmetry, sustained for twelve years, gives us a useful cohort comparison with monthly data publicly available from the Bundesbank’s time-series database. The 2022–24 European interest-rate shock has, additionally, given the regime its first substantive post-implementation stress test.
This article works through what twelve years of public data say about whether the template stabilises retail OEIF flow dynamics. The headline finding is supportive: post-KAGB Pub flow volatility is roughly half its pre-KAGB level, the upper tail of inflow surges has been eliminated, and the 2022–24 rate shock — which produced 62% of months in net outflow in the treated cohort — saw a worst single-month outflow of -0.75% of NAV, an order of magnitude smaller than the -5.6% the same cohort experienced in October 2008. The institutional comparison cohort, which faced the same macro environment without the same redemption restrictions, behaved very differently in both episodes. The empirical case for the toolset is materially strengthened by the German experience; the constraints on generalising it remain real.
The template, the policy, the cohort
The 2008 financial crisis exposed a specific structural fragility in German retail open-ended property funds. The funds offered daily redemption rights against an underlying portfolio of commercial real estate — a textbook liquidity mismatch. When investor confidence broke in autumn 2008, the funds had no choice but to suspend redemptions: Schnejdar, Woltering, Heinrich and Sebastian (2022) document nine retail OEIFs suspending redemptions in October 2008 alone, including KanAm Grundinvest, AXA Immoselect, SEB ImmoInvest, Morgan Stanley P2 Value, CS Euroreal and DEGI International. “By August 2012, all closed funds were forced to announce their liquidations” under the suspension rules then in force.
The KAGB’s 2013 redemption restrictions were the policy response. From 22 July 2013, new investors in retail open-ended property funds could not redeem within 24 months of subscription, and any redemption thereafter required 12 months’ notice. The intent was to better match the liquidity profile of the liability side to the underlying asset class. The same restrictions did not apply to Spezialfonds, the institutional vehicle, which serves professional investors — typically pension schemes, insurance undertakings and corporate treasuries — and operates with negotiated rather than daily redemption terms. Crucially, this means Spez and Pub differ structurally beyond just the KAGB rules: investor base, redemption terms, and to some extent portfolio composition diverge across the cohorts. That is why this analysis treats Spez as a comparison benchmark rather than a true counterfactual.
That regulatory asymmetry, in place since 2013, is what allows the analysis. Both cohorts hold broadly similar underlying assets — German and European commercial real estate. Both experienced the same macro environment. Only one had the redemption restrictions applied to its retail liability structure. The question becomes empirically tractable.
The empirical strategy
This article defines five regimes. Pre-Crisis covers 2000 to 2007: post-euro adoption, pre-shock. Crisis covers January 2008 to July 2013: the wave of suspensions and the run-up to KAGB. Post-KAGB calm covers August 2013 to December 2021: the period during which both cohorts operated under the new rules in a low-rate, generally calm macro environment. Post-KAGB rate shock covers 2022 to 2026: the period during which the European Central Bank raised the deposit facility rate from -0.5% to 4.0% between July 2022 and September 2023, and German commercial real estate valuations corrected meaningfully thereafter. Pre-2000 data is omitted because of the DM-EUR conversion in January 1999, which mechanically distorts level comparisons.
Data come from the Bundesbank’s open-ended-investment-fund statistics — specifically the Net Asset Value, loans-received and net-flow series for both Pub and Spez cohorts. Commercial real estate valuation context comes from the vdp Property Price Index. All series are publicly available and monthly. The Bundesbank series is in DM through December 1998 and EUR thereafter, which is why pre-2000 observations are excluded from the analysis. Note that all percentage values, regime statistics, leverage averages and decompositions in this article are calculated by The Macro Prudential View from the public Bundesbank series; methodology is detailed in the sources section at the end.
The master finding: flow volatility
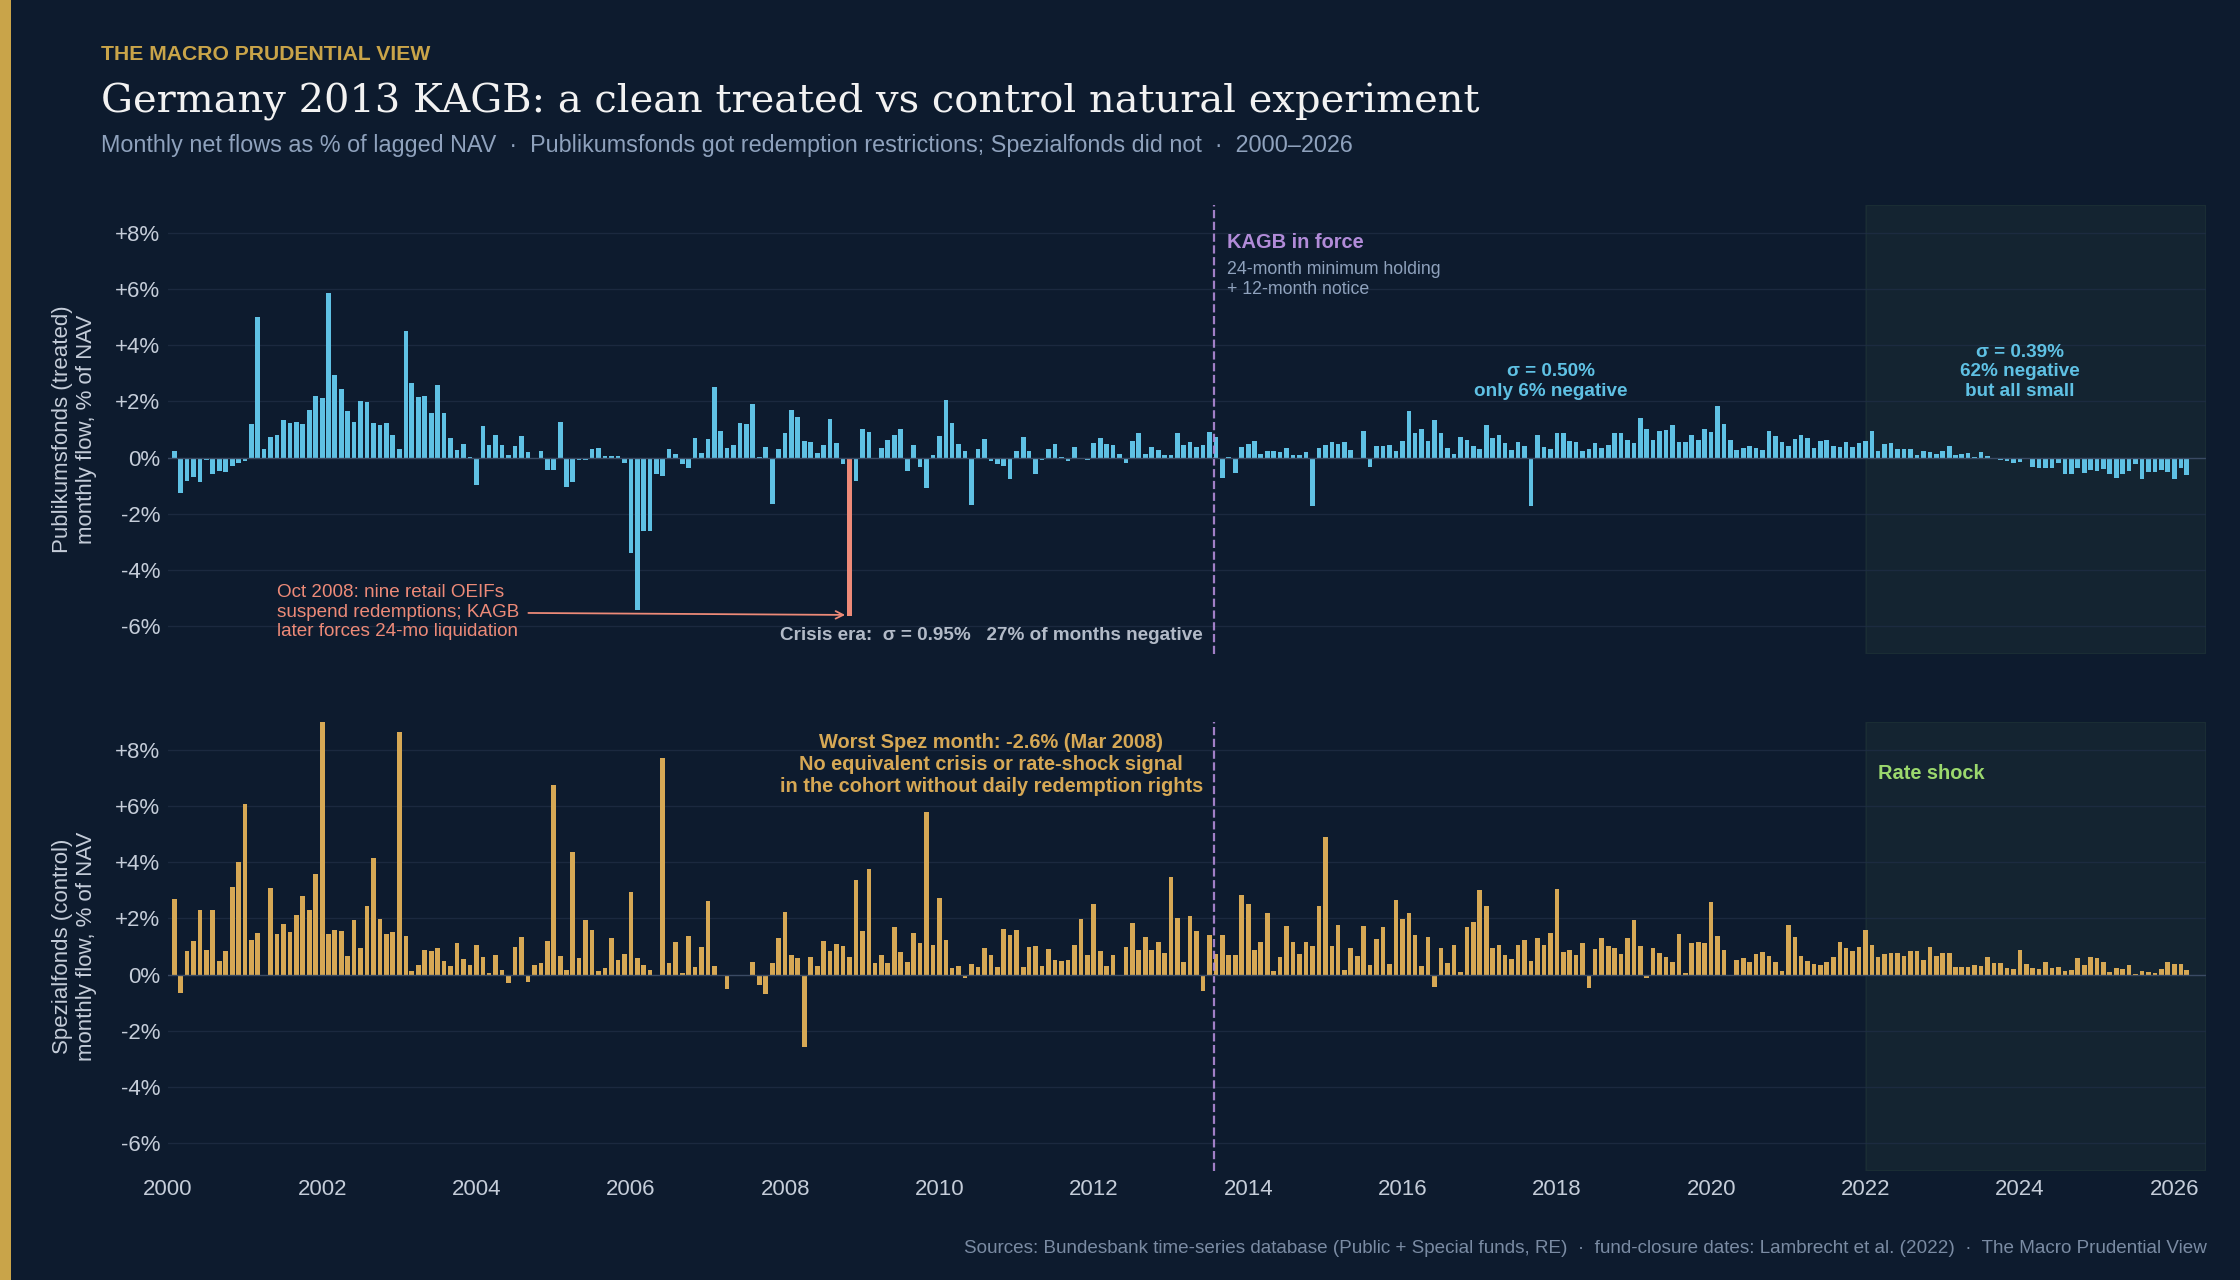
The chart above shows monthly net flows as % of lagged NAV for both cohorts from 2000 to 2026. Post-KAGB Pub flow volatility is structurally lower than pre-KAGB Pub flow volatility — and structurally lower than the institutional comparison cohort over the same period. Pre-Crisis monthly net-flow standard deviation for Pub was 1.53% of prior-month NAV. Crisis-era it dropped to 0.95%, but the worst single month was -5.6% in October 2008 — that is the run dynamics, the single-month redemption pressure that triggered the suspensions. Post-KAGB calm: σ falls to 0.50%, with only 6% of months in net outflow. Post-KAGB rate shock: σ falls further to 0.39%, but with 62% of months in net outflow.
That last regime is the most informative one. The 2022–24 European rate shock was the first genuinely adverse macro environment the post-KAGB regime had to absorb. CRE valuations fell — the vdp office capital-value index dropped from a 2022 peak of around 188 to around 156 by mid-2024, a near-17% correction in commercial property values. Retail investors in German open-ended property funds responded: 62% of months from January 2022 onward saw net outflows. But the magnitude per month was small. The worst single month was -0.75% of NAV. The same cohort in 2008 had a worst month of -5.6%. The redemption-restriction architecture appears to have shaped what investors could do: they could subscribe freely; they could leave but only with notice; the resulting flow trajectory looks like a slow drift rather than a run. Mechanically, the 12-month notice period caps the rate at which any individual subscription can exit, converting what would otherwise be a stampede into a managed queue with a one-year runway for the fund to manage cash buffers and execute property sales.
The institutional comparison cohort tells a complementary story. Spezialfonds had a worst single month in the Crisis era of -2.6% (March 2008) — about half the magnitude of the contemporaneous Pub episode. In the post-2022 rate shock, Spez had zero months of net outflow. Same shock, very different response. The cohort with negotiated rather than daily redemption terms did not exhibit the same run-like dynamics; the structural mismatch was lower to begin with. It is also worth noting that the policy did not eliminate retail demand for liquidity — investors with immediate-exit needs continued to be able to sell their fund shares on secondary venues such as the Hamburg exchange’s Fondsbörse Deutschland at a discount to NAV, shifting the cost of liquidity from the fund’s balance sheet (where it would force asset fire sales) to the exiting investor. Gerlach and Maurer (2020) document the secondary-market dynamics in detail, showing that “OREF shares are traded at a discount on secondary markets when the fund management suspends the redemption of shares or when the fund is being liquidated” — i.e., the secondary market prices the trapped-liquidity risk explicitly, leaving the underlying fund balance sheet intact.
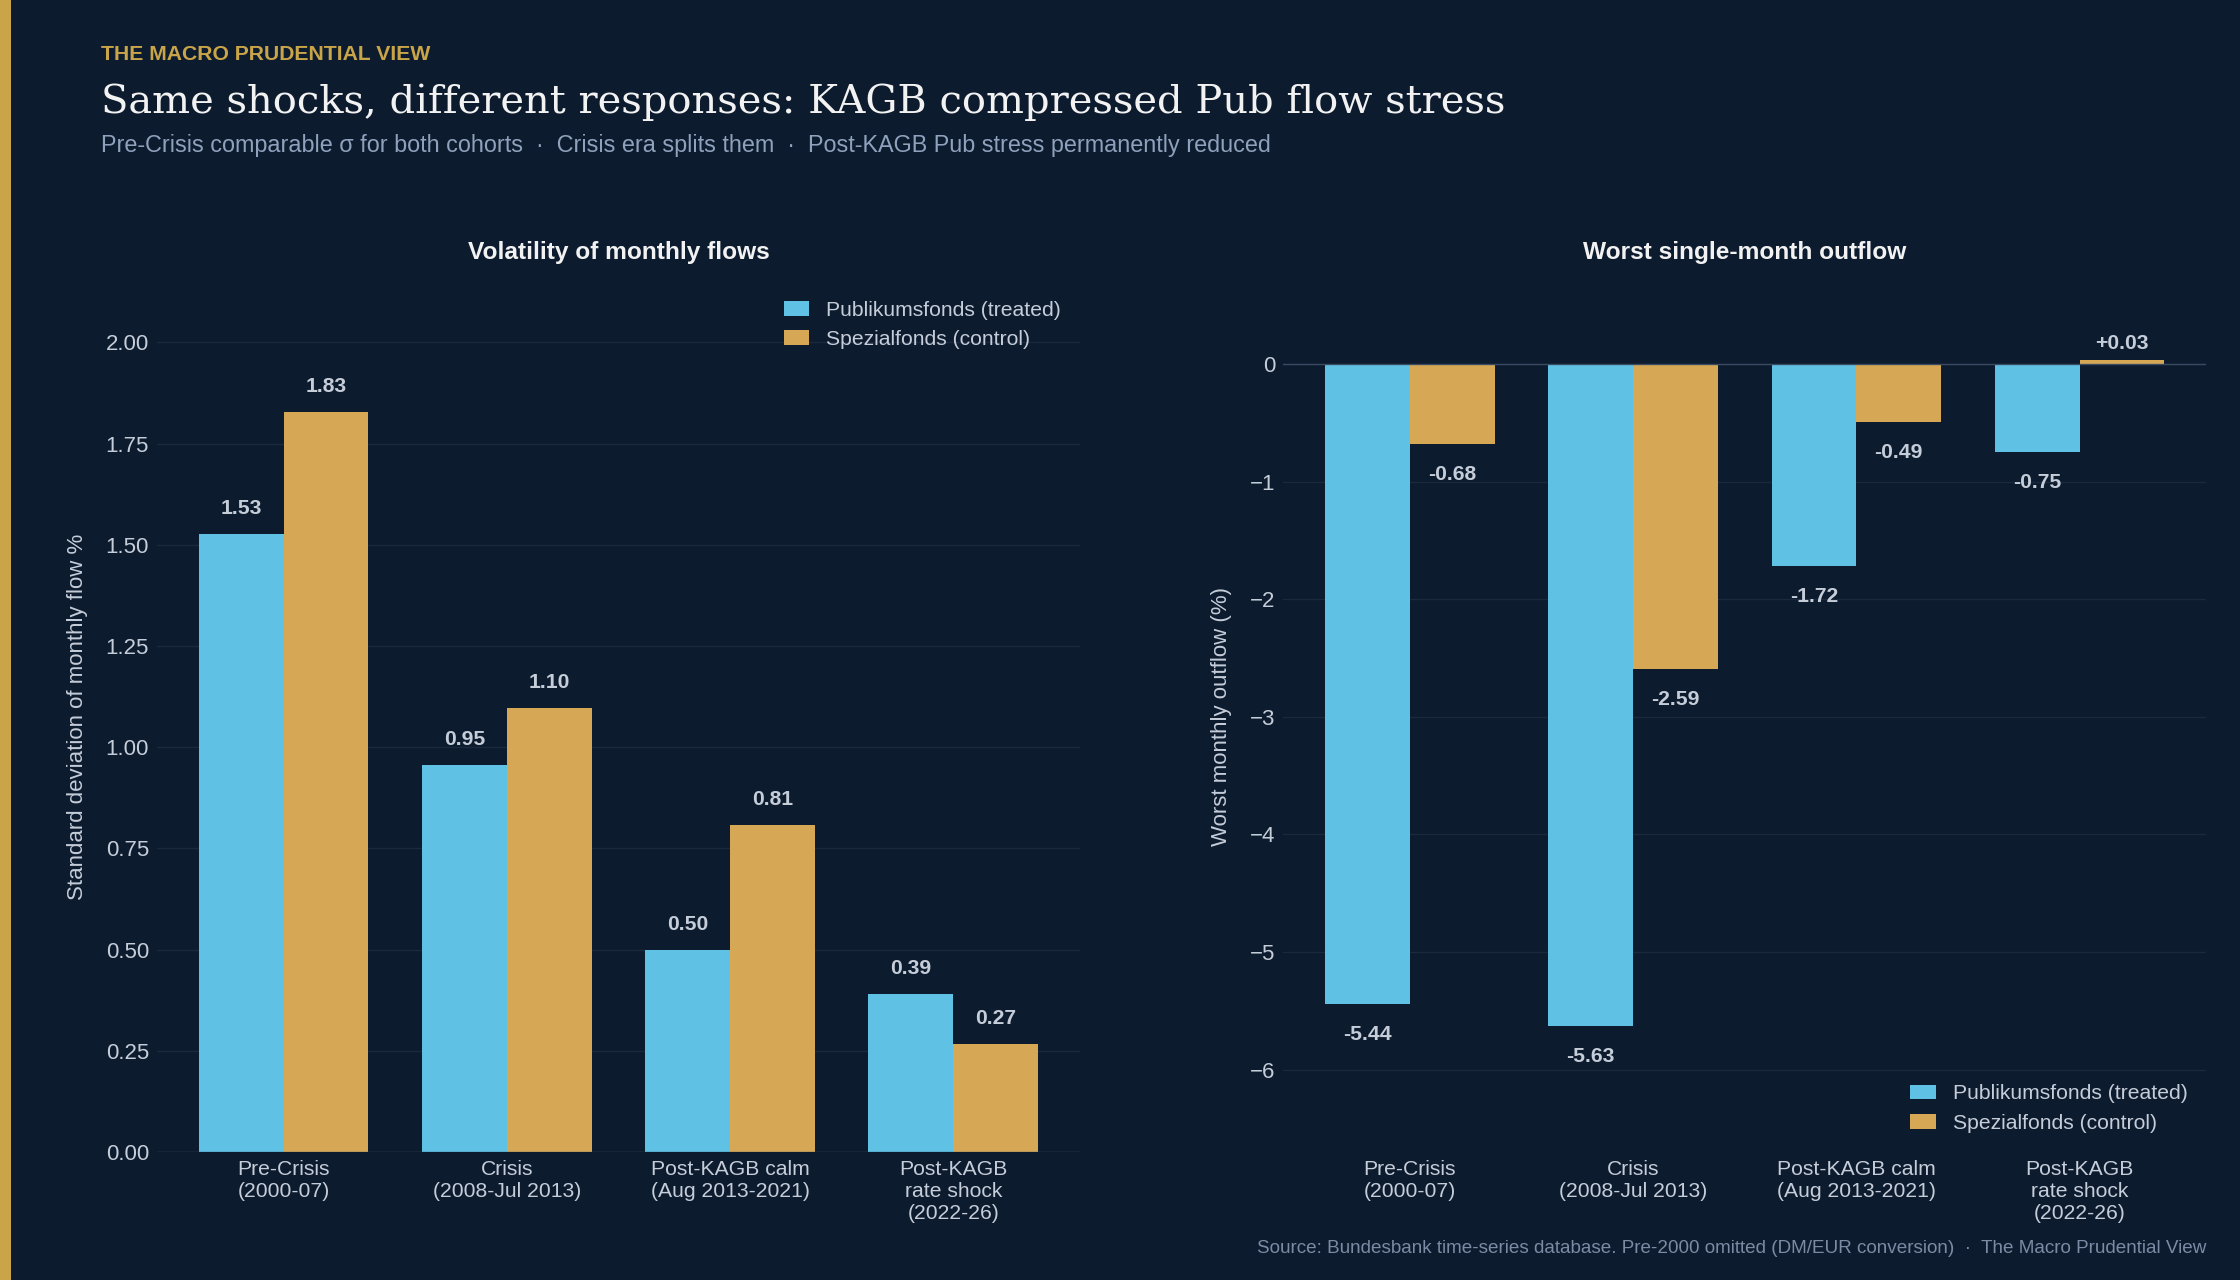
The chart bove distils the same finding to summary statistics across the four post-2000 regimes. Pre-Crisis, the two cohorts looked quantitatively similar — Pub σ of 1.53%, Spez σ of 1.83%, neither with extreme outflow months. Crisis era split them: Pub took the run dynamics, Spez did not. Post-KAGB calm: both cohorts compressed, with Pub at the lower stress level. Post-KAGB rate shock: Pub stress remained reduced even though 62% of months were in outflow, because each individual month’s outflow was small. The right-hand panel — worst single-month outflow by regime — shows the monotonic pattern most clearly. Pub: -5.4%, -5.6%, -1.7%, -0.75%. Spez over the same regimes: -0.7%, -2.6%, -0.5%, +0.0%. Same data, same broad asset class, different stress profile depending on whether the redemption-restriction architecture is in place. (Regime labels here are analytical sample partitions, not official supervisory classifications.)
Sectoral substitution
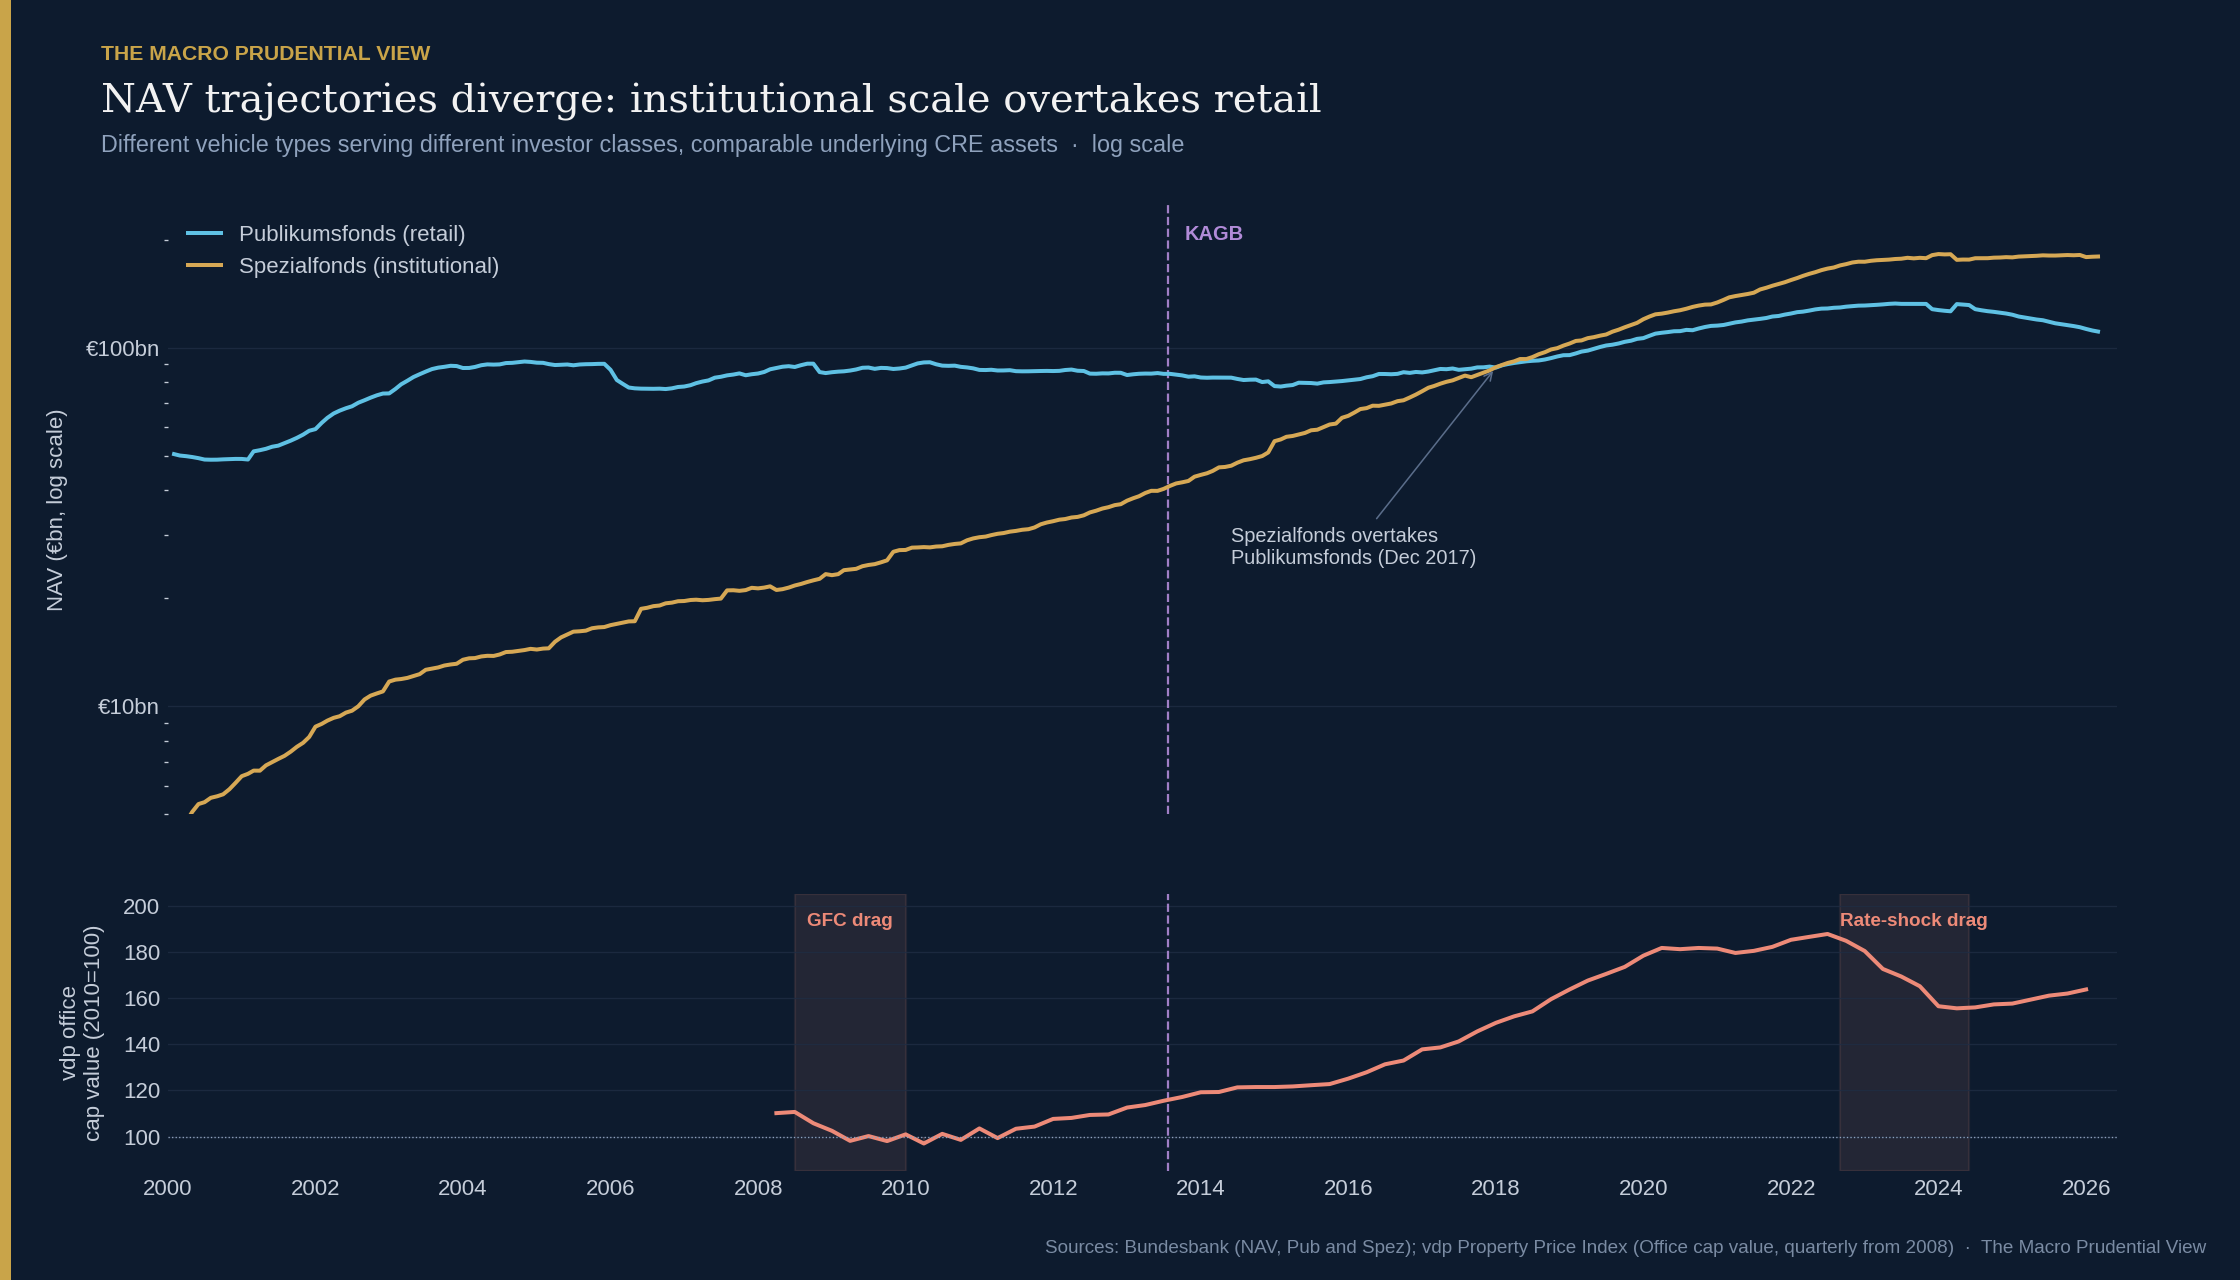
A separate observation, less prominent in the policy debate, is shown in the chart above: Spez NAV overtook Pub NAV in December 2017. From end-1993 to end-2025, Pub NAV grew about 2.5×; Spez NAV grew about 63×. The sector now sits at roughly €112bn of retail and €179bn of institutional NAV (latest available data, end-2025). The two trajectories are different vehicle types serving different investor classes, but they hold broadly comparable underlying assets — institutional scale has overtaken retail scale within the same broad German CRE fund universe.
This is genuinely ambiguous. One reading is that the KAGB redemption restrictions made the retail vehicle less attractive to investors who wanted liquidity, displacing money toward the institutional channel. Another reading is that the institutional CRE allocation grew secularly across the post-2010 period for reasons entirely unrelated to KAGB — German pension funds and insurance undertakings deploying duration-matched property allocations in a low-rate world, a trend visible across continental Europe regardless of OEIF regulation. The Bundesbank time series alone cannot separate these two explanations.
What it can say is that the redemption-management regime did not destroy the German CRE fund channel. Total NAV across both cohorts is higher than at any pre-2013 point. The institutional channel’s growth replaced the retail channel’s growth, but the function — providing intermediated CRE exposure — continued. For the Eurosystem proposal, this matters: the most concrete worry about ex-ante liquidity tools is that they push activity out of the regulated channel rather than reducing the underlying mismatch. The German evidence does not support that worry strongly, though the substitution toward institutional vehicles is consistent with a softer version of it.
Liability-side risk reduction
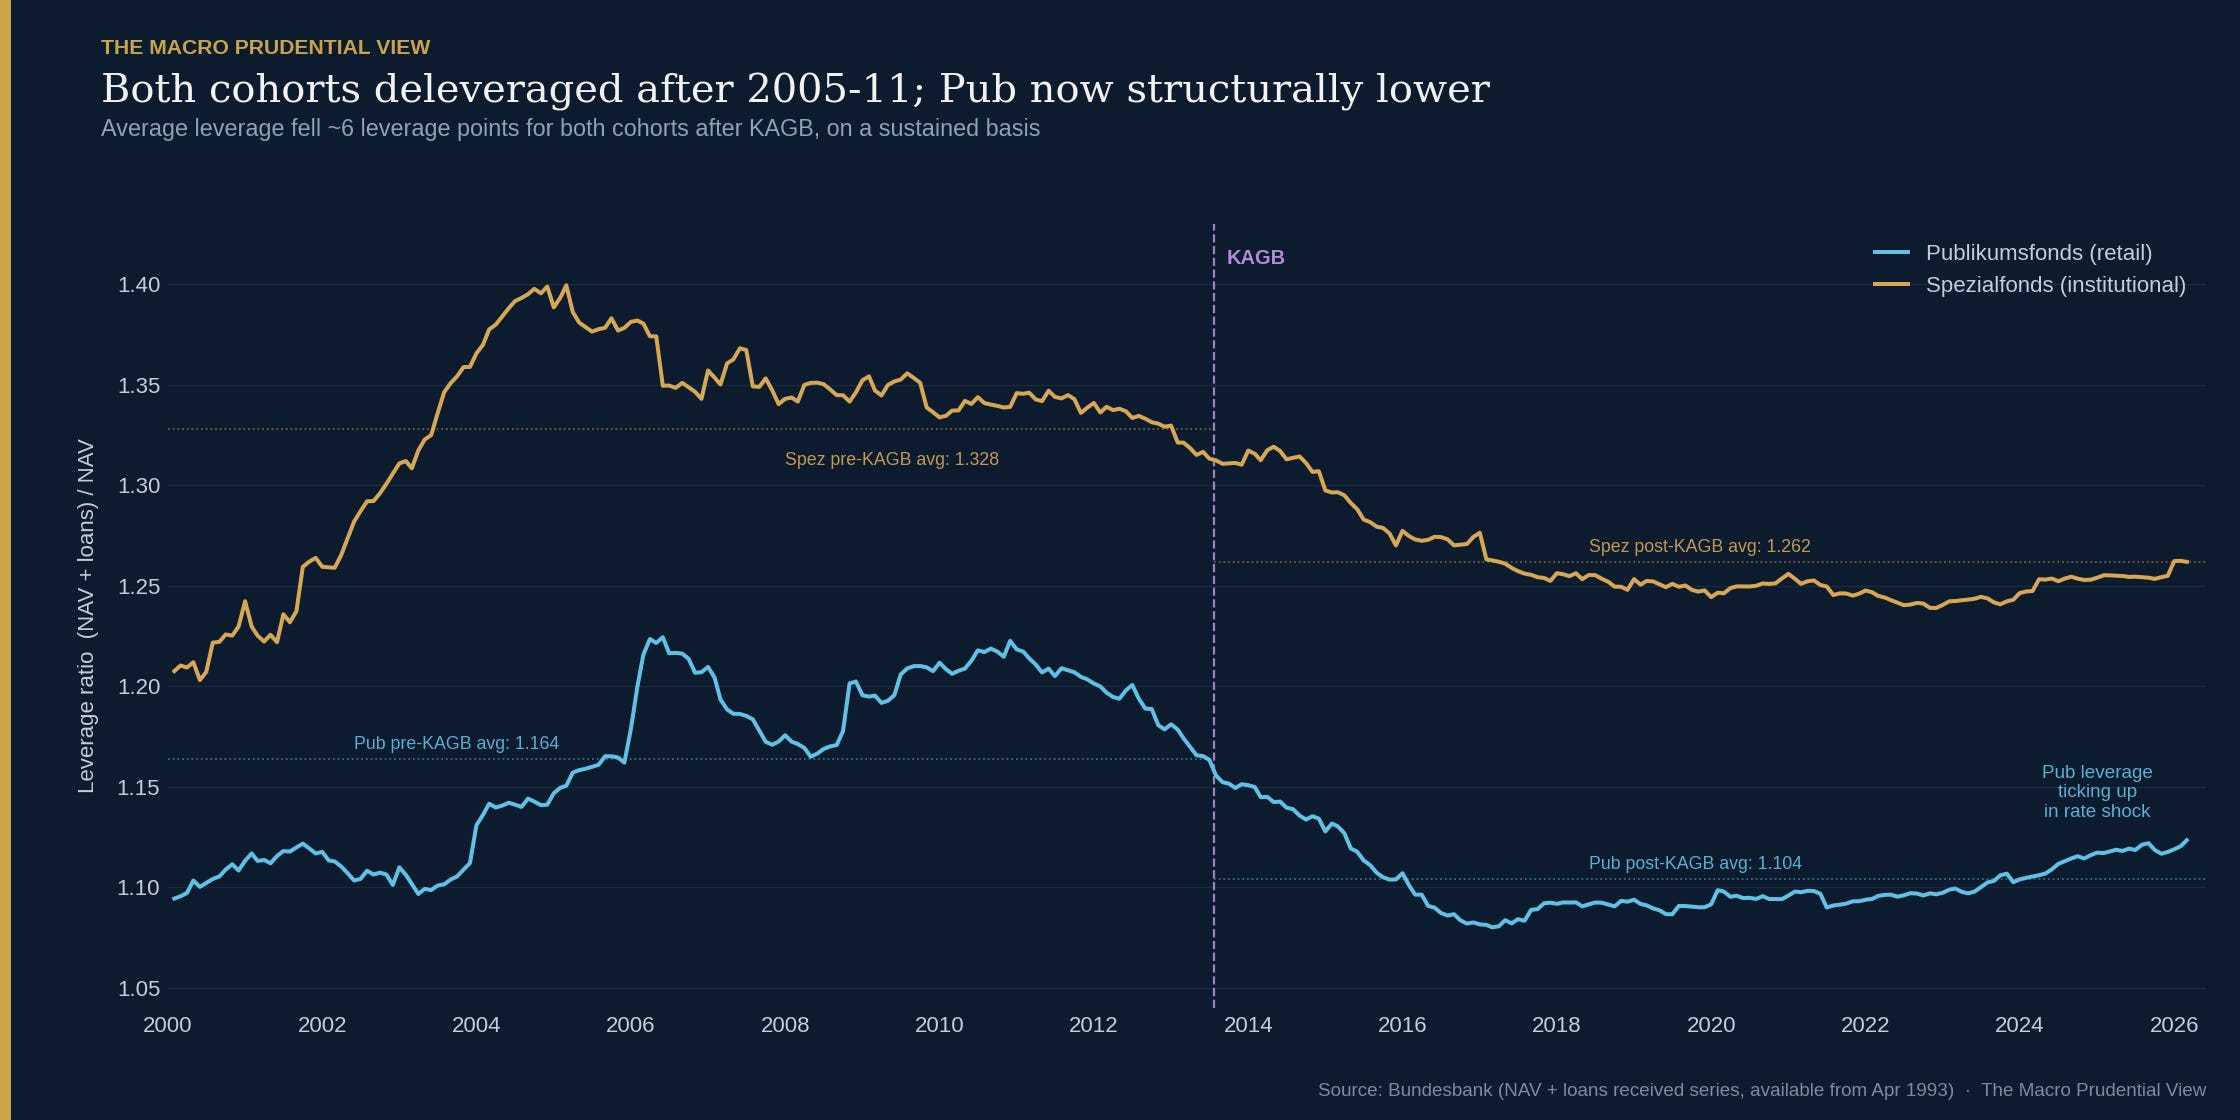
The chart above shows that both cohorts deleveraged from mid-2000s peaks. Pre-KAGB averages: Pub 1.16, Spez 1.33. Post-KAGB averages: Pub 1.10, Spez 1.26. Pub now operates at structurally lower leverage; Spez also moved down but remains higher.
This is not cleanly attributable to KAGB. Both cohorts deleveraged, in roughly parallel trajectories, suggesting macro factors — interest rates, supervisory pressure, generalised risk aversion through the 2008–2014 period — affected both. KAGB plausibly contributed to the lower steady-state Pub level, particularly as the regime took hold and new fund launches operated under the new rules from inception. But isolating the KAGB-specific contribution from the broader deleveraging would require fund-level data and a more demanding identification strategy than the cohort comparison provides.
What the chart does show is that the liability-side risk reduction the redemption-management regime was meant to encourage occurred. Pub funds today carry less debt against NAV than they did pre-Crisis. The 2022 rate shock produced a small uptick — visible at the right edge of the chart — that is worth monitoring but has not undone the post-KAGB structural shift.
What this means for the Eurosystem proposal
The German evidence supports the empirical proposition that ex-ante OEIF liquidity tools — minimum holding periods, redemption notice periods — stabilise retail OEIF flow dynamics in the face of substantial macro stress. The 2022–24 rate shock is the relevant validation: it occurred under the post-KAGB regime, with European CRE valuations correcting by mid-double digits, and the treated cohort absorbed it through a slow drift in flows rather than the run dynamics that defined 2008. Twelve years of post-implementation data, including a real-world adverse regime, suggest the redemption-management toolset works in this context.
Three constraints on inference are worth flagging. First, the German cohort was already moving toward institutional dominance through the 2010s, for reasons partly independent of KAGB. The substitution between Pub and Spez may be larger than the data alone can attribute to the policy. Second, the 2022–24 period was a rate shock with associated CRE valuation stress, not a pure redemption run; the KAGB regime has not yet been tested by a fast-moving liquidity event of the September 2022 gilt-crisis variety. The German evidence is about whether the toolset handles slow stress, not whether it handles sudden stress. Third, the cohort definition — German retail open-ended property funds — is narrower than the Eurosystem report’s proposed scope. Generalising to other markets and structures should be tested case-by-case rather than assumed.
Net: the empirical case is positive enough to support the report’s direction. The German data make it difficult to dismiss the proposition that ex-ante liquidity tools can work in practice. The lighter version of the question — do they work in all the markets and structures the report covers? — remains open and worth investigating case-by-case.
Paweł Fiedor - The Macro Prudential View
Part 2: Ireland’s CBI deployed analogous measures twice in three years — to property funds in 2022 and Sterling LDI in 2024 — providing the first cross-country test of how the template generalises.
Sources and methodology
ECB (May 2026), Strengthening the macroprudential lens in the regulation of non-bank financial intermediation. Eurosystem report.
Schnejdar, Sebastian; Woltering, René-Ojas; Heinrich, Michael; Sebastian, Steffen (2022), Fund Closure Risks of Open-End Real Estate Funds. Journal of Real Estate Research.
Gerlach, Patrick; Maurer, Raimond (2020), The Growing Importance of Secondary Market Activities for Open-end Real Estate Fund Shares in Germany. Schmalenbach Business Review 72, 65–106.
Deutsche Bundesbank, Investment companies time-series database — open-end investment companies, real estate sector. Public monthly series for both Publikumsfonds and Spezialfonds, covering Net Asset Value, loans received from financial institutions, and net flows.
vdp Property Price Index, Verband deutscher Pfandbriefbanken (Q1 2003 – Q4 2025) — office capital values used for CRE valuation context.
ECB key interest rates — deposit facility rate series for the 2022–23 ECB tightening cycle.
Calculations. All percentage values, regime statistics, leverage averages and decompositions are computed by The Macro Prudential View from the Bundesbank monthly series. Monthly net flow as % of NAV is calculated as net flow in month t divided by NAV at end of month t-1, multiplied by 100. Standard deviation is the sample standard deviation of monthly flow %s within each regime. Leverage is calculated as (NAV + loans received) / NAV. Pre/post-KAGB averages use 22 July 2013 as the regime break, with August 2013 as the first full post-KAGB month. Pre-2000 observations are excluded throughout because of the DM-EUR conversion in January 1999, which mechanically distorts level comparisons. Working spreadsheet available on request.
Views are my own.