



There is a particular kind of financial confidence that deserves to be treated with suspicion. It is the confidence of those who design a system and then assure you, with impressive technical vocabulary, that the system cannot fail in precisely the way it is currently failing. Private credit has been producing this variety of assurance for several years now. The funds were semi-liquid, not illiquid. The caps were prudent, not restrictive. The ratings were rigorous, not captured. And the investors — overwhelmingly wealthy, sophisticated, advised — surely understood what they were getting into.
They did not, or they did and are now pretending otherwise. Either way, the exits are crowded.
I. The Mechanics of a Run
The chart below, sourced from Robert A. Stanger & Co. via the Wall Street Journal, tells the story with brutal economy. For most of 2022 through 2025, redemption requests from non-traded business development companies were manageable — a steady trickle of met withdrawals, small unmet amounts, nothing that disturbed the promotional material. Then in Q1 2026 the bars fall off a cliff.
What happened was not, despite what several asset managers have implied, a wave of irrational panic. It was rational behaviour, made inevitable by the structure of the funds themselves. To see why, consider a simple payoff table.
Imagine you are an investor in one of these funds. You have two choices: stay in, or request redemption. The fund has a 5% quarterly cap on withdrawals. Other investors face the same choice. The payoffs look something like this:
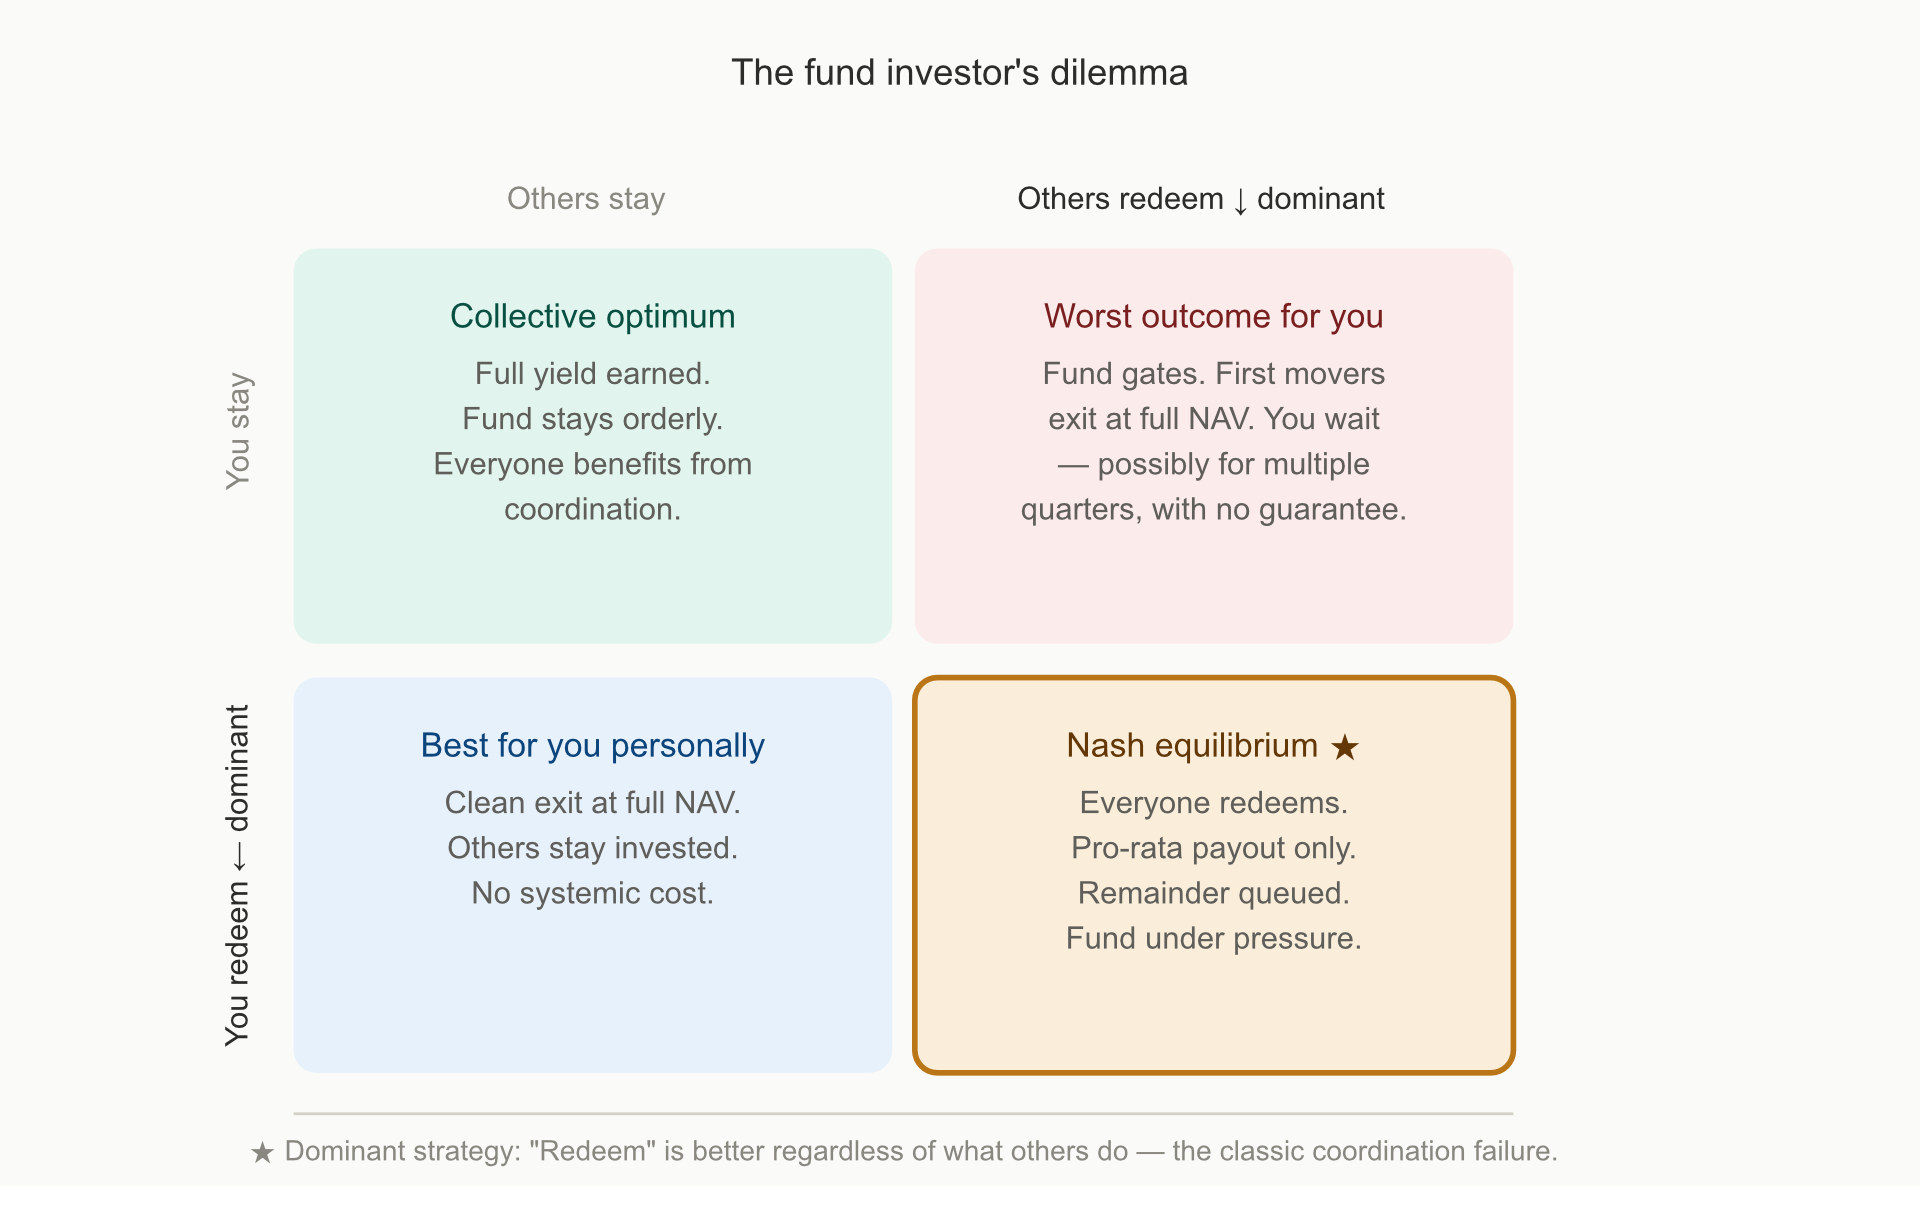
This is not a complicated game. The dominant strategy — the one that makes sense regardless of what others do — tilts toward redemption the moment you have any reason to doubt that everyone else will stay. And in early 2026, reasons to doubt were not in short supply. Loan defaults at First Brands and Tricolor. Blue Owl cancelling a fund merger. BlackRock TCP Capital reporting a 19% NAV write-down in a single quarter — having told investors just seven weeks earlier that its non-accrual ratio had improved. Once a few investors act on these signals, the logic becomes self-reinforcing. The run is not irrational. It is the Nash equilibrium.
Diamond and Dybvig described this mechanism for banks in 1983. The insight — that a solvent institution can be destroyed by a coordination failure among its creditors — earned a Nobel Prize in 2022. Private credit fund designers knew about Diamond-Dybvig. They believed quarterly caps and NAV pricing made their structures immune to it. What they underestimated was the first-mover advantage embedded in the cap itself: if only 5% can exit per quarter and you think 15% will try, the race to be in the first 5% is exactly the run they said couldn’t happen.
The data from four major funds in Q1 2026 illustrates how differently this played out depending on who blinked first.
Blackstone, running the largest fund, chose to protect its franchise at almost any cost — upsizing to 7% and injecting $400 million of firm and employee capital to meet 100% of requests. The optics required it; BCRED is too central to Blackstone’s retail strategy to be seen gating. Ares was more orthodox: it stuck to its 5% cap and pro-rated, leaving 57% of requests unmet. Blue Owl had two funds in the data. Its technology lending vehicle received requests totalling 40.7% of NAV — 5% paid out. Its marquee $20 billion direct lending fund, OCIC, saw requests reach 21.9% of fund value — again, 5% paid out. Across both vehicles combined, Blue Owl faced over $5.4 billion in redemption requests in a single quarter.
Public markets have already delivered their verdict. Blue Owl’s listed stock has fallen 61% over the past year, with the sharpest leg down beginning in January 2026 as redemption data began to emerge. There is a particular irony in the numbers: $OWL’s dividend yield has now risen to approximately 10% — higher than the distribution rate on its own non-traded BDC, OCIC, which pays around 8.9% to Class I investors. Those investors, locked in at the 5% quarterly cap, are earning less yield than they could obtain by buying the publicly traded manager at a distressed price in the open market. The illiquidity premium has not merely compressed. It has inverted.
II. The Banks Are in There Too, Somewhere
The direct redemption story is dramatic enough. But private credit does not exist in isolation. It sits inside a web of financing relationships that connects it, with varying degrees of visibility, to the banking system and beyond — as the diagram below shows.
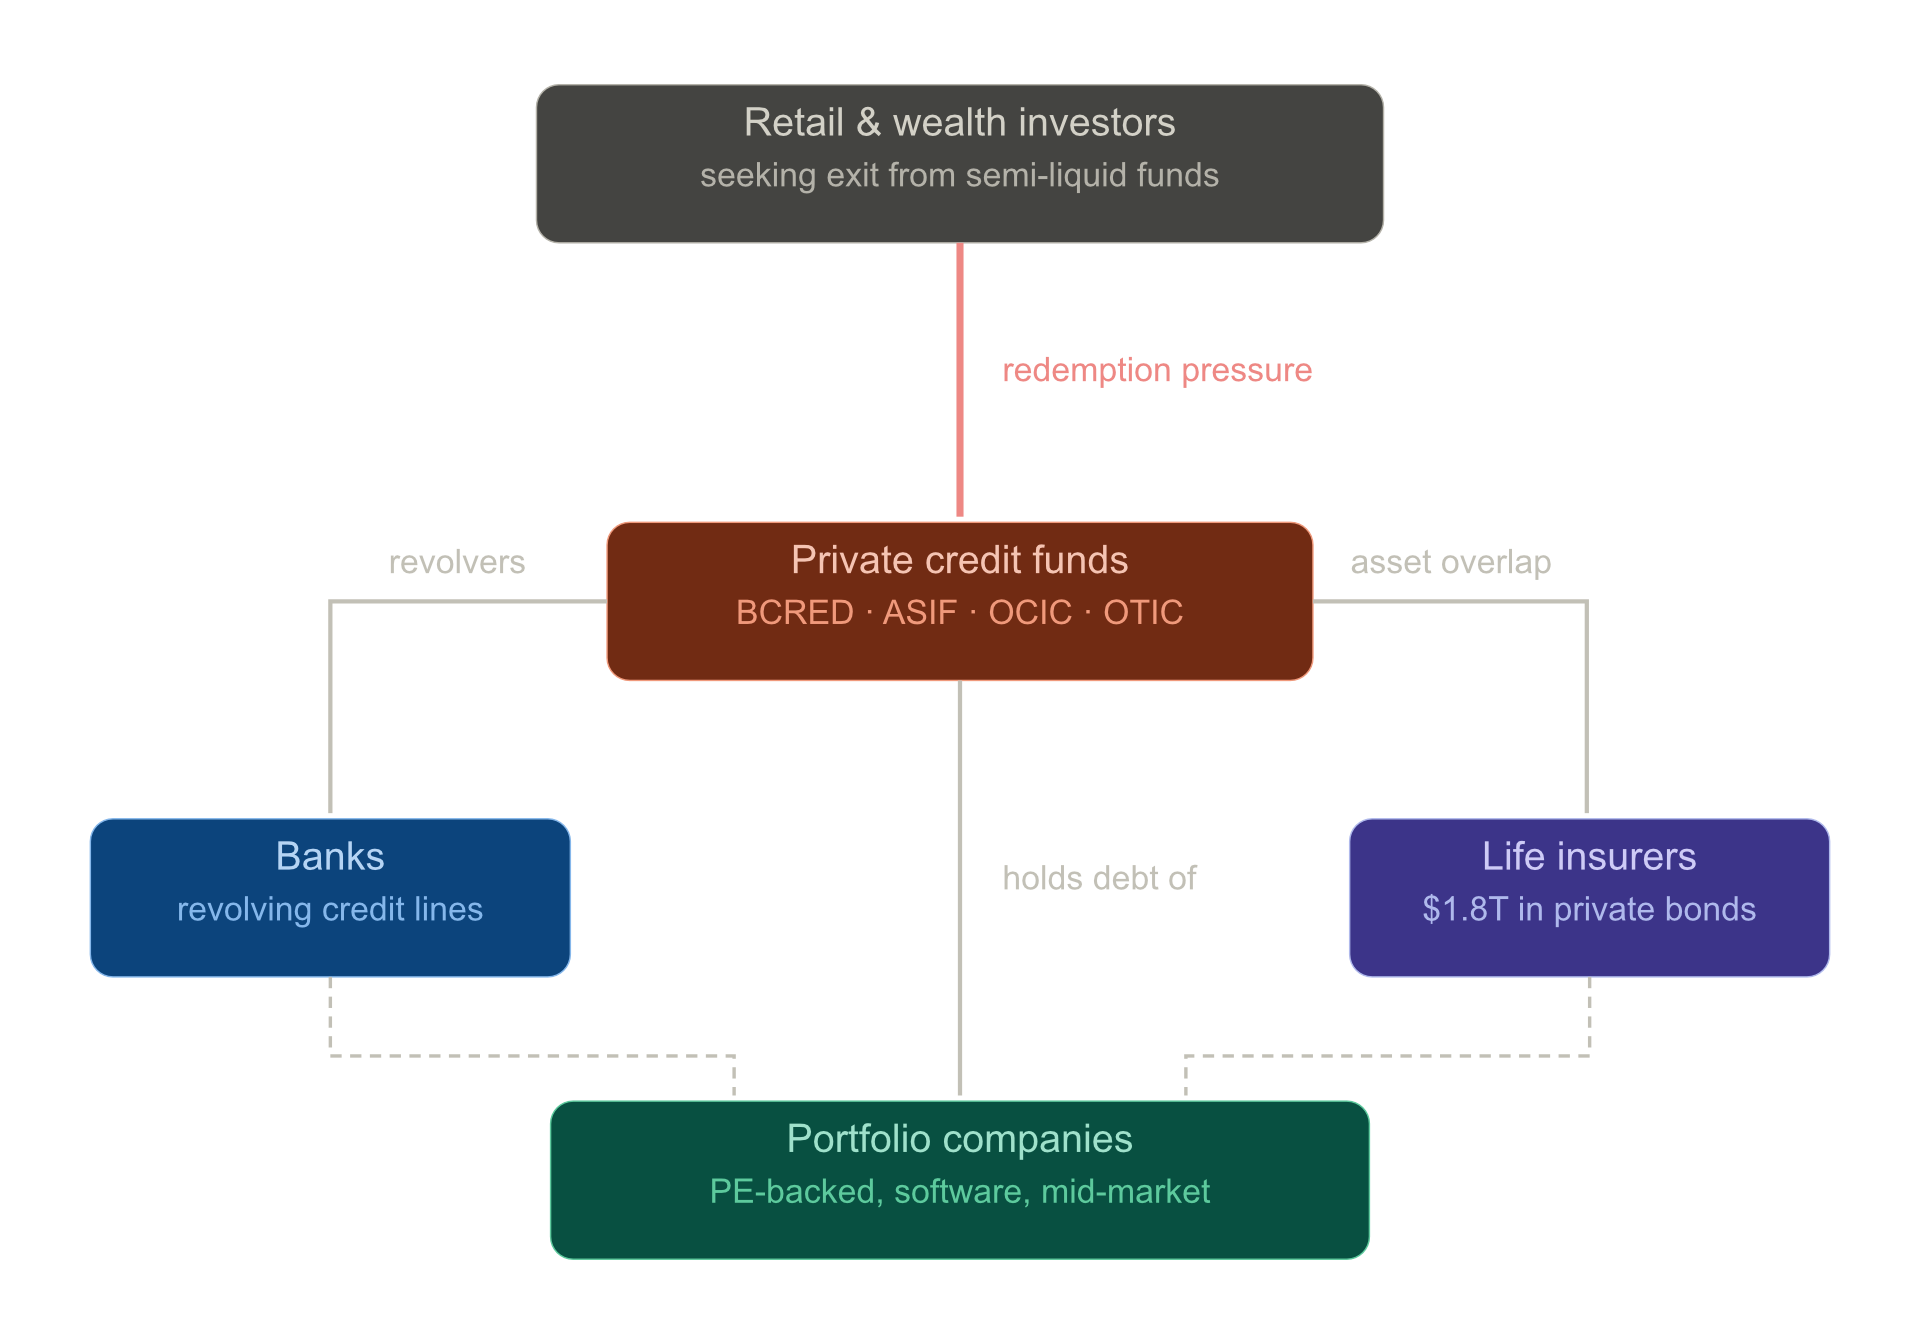
The mechanism is straightforward. Funds like BCRED maintain enormous revolving credit facilities to manage deployment timing — BCRED alone disclosed $42.8 billion in committed debt capacity as of February 2026, drawn from over twenty banking relationships. These facilities are not passive. In a stress scenario, where portfolio companies draw on their own revolvers simultaneously, private credit funds may face sudden calls on liquidity from two directions at once: redeeming investors pulling from above, and borrowers drawing from below.
This is precisely the liquidity squeeze the IMF flagged in its April 2024 Global Financial Stability Report, which devoted an entire chapter to private credit. The report concluded, with the careful language of official bodies who do not wish to cause the crisis they are describing, that “liquidity risk could rise with the growth of retail funds.” It also noted that “multiple layers of leverage create interconnectedness concerns.” The full chain runs from bank revolvers to fund leverage to portfolio company debt to, ultimately, the retail investor who thought they were buying a slightly illiquid bond fund.
The portfolio overlap problem is harder to quantify but no less real. Private credit funds, competing for the same middle-market deals with similar underwriting standards, have inevitably accumulated correlated exposures. When First Brands went bankrupt, it was not a single fund’s problem. And the software sector — 21% of the Ares Strategic Income Fund’s portfolio, a similar proportion for many peers — represents a concentrated bet on AI-resilience that the market is now pricing with considerably more scepticism than it was a year ago.
The opacity runs deeper still, into the metrics that managers have been citing as evidence of portfolio health. Before examining the accounting, it is worth noting what the headline credit data already shows. According to Fitch Ratings, the default rate in its US private middle market portfolio reached 9.2% in 2025, up from 8.1% in 2024 — more than double the 4.5% default rate in the broadly syndicated loan market. Fitch notes that realised lender losses remained minimal, due to deferred payments and extended maturities. That caveat deserves scrutiny: deferred and extended is precisely the mechanism the non-accrual accounting exploits. Losses that have not yet been crystallised do not show up in the metrics managers show investors. The asset class that was sold as offering superior credit discipline has, at this point in the cycle, defaults running at twice the rate of the public market it was supposed to improve upon — and a reporting framework that is reasonably good at making them invisible until they are not.
And yet the fund-level metrics have not told this story clearly. The non-accrual ratio — the standard measure of loans in distress — is subject to a systematic distortion that makes it least reliable precisely when it matters most. When an impaired loan is restructured and written off, it exits the non-accrual count. The numerator shrinks. The percentage improves. Management issues a press release about progress.
This is what happened at BlackRock TCP Capital through most of 2025. Detailed analysis of the fund’s SEC filings — tracing every non-accrual loan back to its 2022 vintage — shows that more than half of the restructured positions ultimately ended in zero recovery. Not partial recovery. Zero. The non-accrual metric improved because the losses were being crystallised and removed from the denominator, while accounting reversals from those same restructurings generated unrealised “gains” that masked further deterioration. When Q4 2025 arrived with no restructurings left in the pipeline, the new markdowns hit NAV all at once.
This is not a TCPC-specific pathology. It is how BDC loan losses flow through financial statements — a feature of the accounting, not a bug introduced by any particular manager. The implication for investors reading fund reports is uncomfortable: a falling non-accrual ratio may be less a sign of recovery than a sign that the reckoning has already happened and is now invisible. To be fair to the managers: realized losses across the sector remain contained so far, and the bilateral nature of private credit relationships does allow for workouts and extensions that public bond markets cannot offer. The question is whether those workouts are resolving problems or deferring them — and on that question, the Fitch default data and the TCPC case study point in the same direction.
III. The Insurer in the Room
The Treasury meeting in April 2026 with domestic and international insurance regulators was not a courtesy call. It was an acknowledgement, carefully worded but unmistakable in its implications, that the private credit stress has a second act — one that runs through the balance sheets of American life insurers.
The connection has been building for a decade. Private credit, with its yield premium over public bonds and its apparent stability, was an almost irresistible proposition for life insurers seeking to match long-duration liabilities. The numbers confirm what the promotional material promised: private credit now accounts for roughly 46% of life insurer bond holdings, up from 29% a decade ago.
The concern is not simply the size of the exposure. It is the opacity. Life insurers have moved aggressively into private credit that is rated not by Moody’s or S&P, but by specialist private rating agencies whose methodologies are, in the Treasury’s delicate formulation, “called into question.” The NAIC has launched a study specifically into these securitised products. Several large insurers have moved substantial blocks of business to offshore reinsurers in Bermuda and the Cayman Islands, where regulatory standards are less demanding — a structure that makes consolidated risk assessment difficult even for those trying to perform it.
The particular risk here is not the same as the bank run. Life insurers are not facing redemption requests in any direct sense. But they are exposed to mark-to-market pressures if private credit valuations begin to reflect reality, to potential capital charges if rating agencies revisit their assessments, and to the generalised loss of confidence that tends to accompany the discovery that a large asset class was priced more optimistically than its fundamentals warranted. The feedback loop back to the funds themselves is worth noting: insurers facing valuation pressure or capital charges may reduce new allocations to private credit or, in stress scenarios, look to exit existing positions — adding to the redemption pressure at the fund level that started this story.
IV. Coming to a Continent Near You
Private credit is not an American story that Europeans can observe from a comfortable distance. The fundraising data makes this uncomfortable.
Europe’s share of private credit fundraising rose from 23% in 2024 to 33% in 2025 — a ten percentage point shift in a single year — while North America’s share fell from 72% to 63%, according to PitchBook’s 2025 Annual Global Private Market Fundraising Report. In absolute terms, European private debt fundraising hit a record $79.4 billion in 2025, up nearly 40% from the prior year. Much of this reflects a genuine structural shift: European companies have historically relied more heavily on bank financing than their American counterparts, and as European banks have retreated from leveraged lending under Basel III capital requirements, private credit has stepped into the gap. Two mega-funds — Ares Capital Europe VI (€17.1bn) and CVC European Direct Lending (€10.4bn) — helped push the numbers, but the trend predates them.
The regulatory architecture that might catch the problems is less developed. The ECB’s Financial Stability Review has flagged private credit risks with increasing urgency, but European insurance supervision remains fragmented across national authorities, and the Solvency II framework was not designed with the complexity of modern private credit structures in mind. The offshore reinsurance issue — Bermuda, Cayman — applies to European insurers too, perhaps more acutely given that several large European insurers have partnered with precisely the American private equity managers now at the centre of the US stress.
The pattern should be familiar to anyone who watched the 2008 crisis unfold. The instrument was invented in America, the risks were distributed globally, and the European discovery of the problem came with a lag that felt, in retrospect, embarrassingly preventable.
Private credit is not subprime. The borrowers are not buying houses they cannot afford; they are, mostly, established companies with genuine cash flows. But the structural parallel holds. This is an asset class that grew rapidly on the promise of higher returns and lower correlation. It was financed by retail and institutional capital that did not fully price the liquidity risk. It is now embedded in insurance balance sheets across two continents, and encountering its first serious test at a scale for which the architecture was not designed.
The architects, for their part, are confident the structure will hold. They were confident before, too. The more interesting question — the one Q2 and Q3 2026 will begin to answer — is what happens when the next round of NAV marks arrives, restructuring pipelines thin out, and quarterly redemption requests remain at levels the 5% cap was never designed to absorb. At that point, the difference between a liquidity stress and a solvency stress becomes less academic than it currently sounds.
The author writes on macroprudential and financial stability issues. Charts produced using data from Robert A. Stanger & Co., SEC EDGAR, Bloomberg, PitchBook, Milliman/S&P Global and the NAIC Capital Markets Bureau. The analysis of BlackRock TCP Capital’s non-accrual accounting draws on work by LeylaKuni, published at Accredited Investor Insights — strongly recommended. Blue Owl redemption data from SEC filings (April 2026); Fitch default rate from Fitch Ratings, “Private Credit Defaults & Recoveries 2025”, June 2026 (fitchratings.com).