



A leverage ratio is a fraction, and a fraction can rise for reasons that have nothing to do with each other. Between mid-2022 and mid-2026, the credit leverage of euro area real estate investment funds — loans and deposits received on the funds’ own balance sheets, as a share of total assets, from the ECB’s investment fund statistics — rose in Austria from 5% to 15%, in Portugal from 13% to 19%, in France from 4% to 9%, and in Finland from 21% to 25%. A league table built on those endpoints would tell you almost nothing. Decomposed into what actually moved — net borrowing transactions, other changes in the loan stock, and the balance sheet underneath — the same four numbers turn out to describe three distinct mechanisms, and one country mixing them.
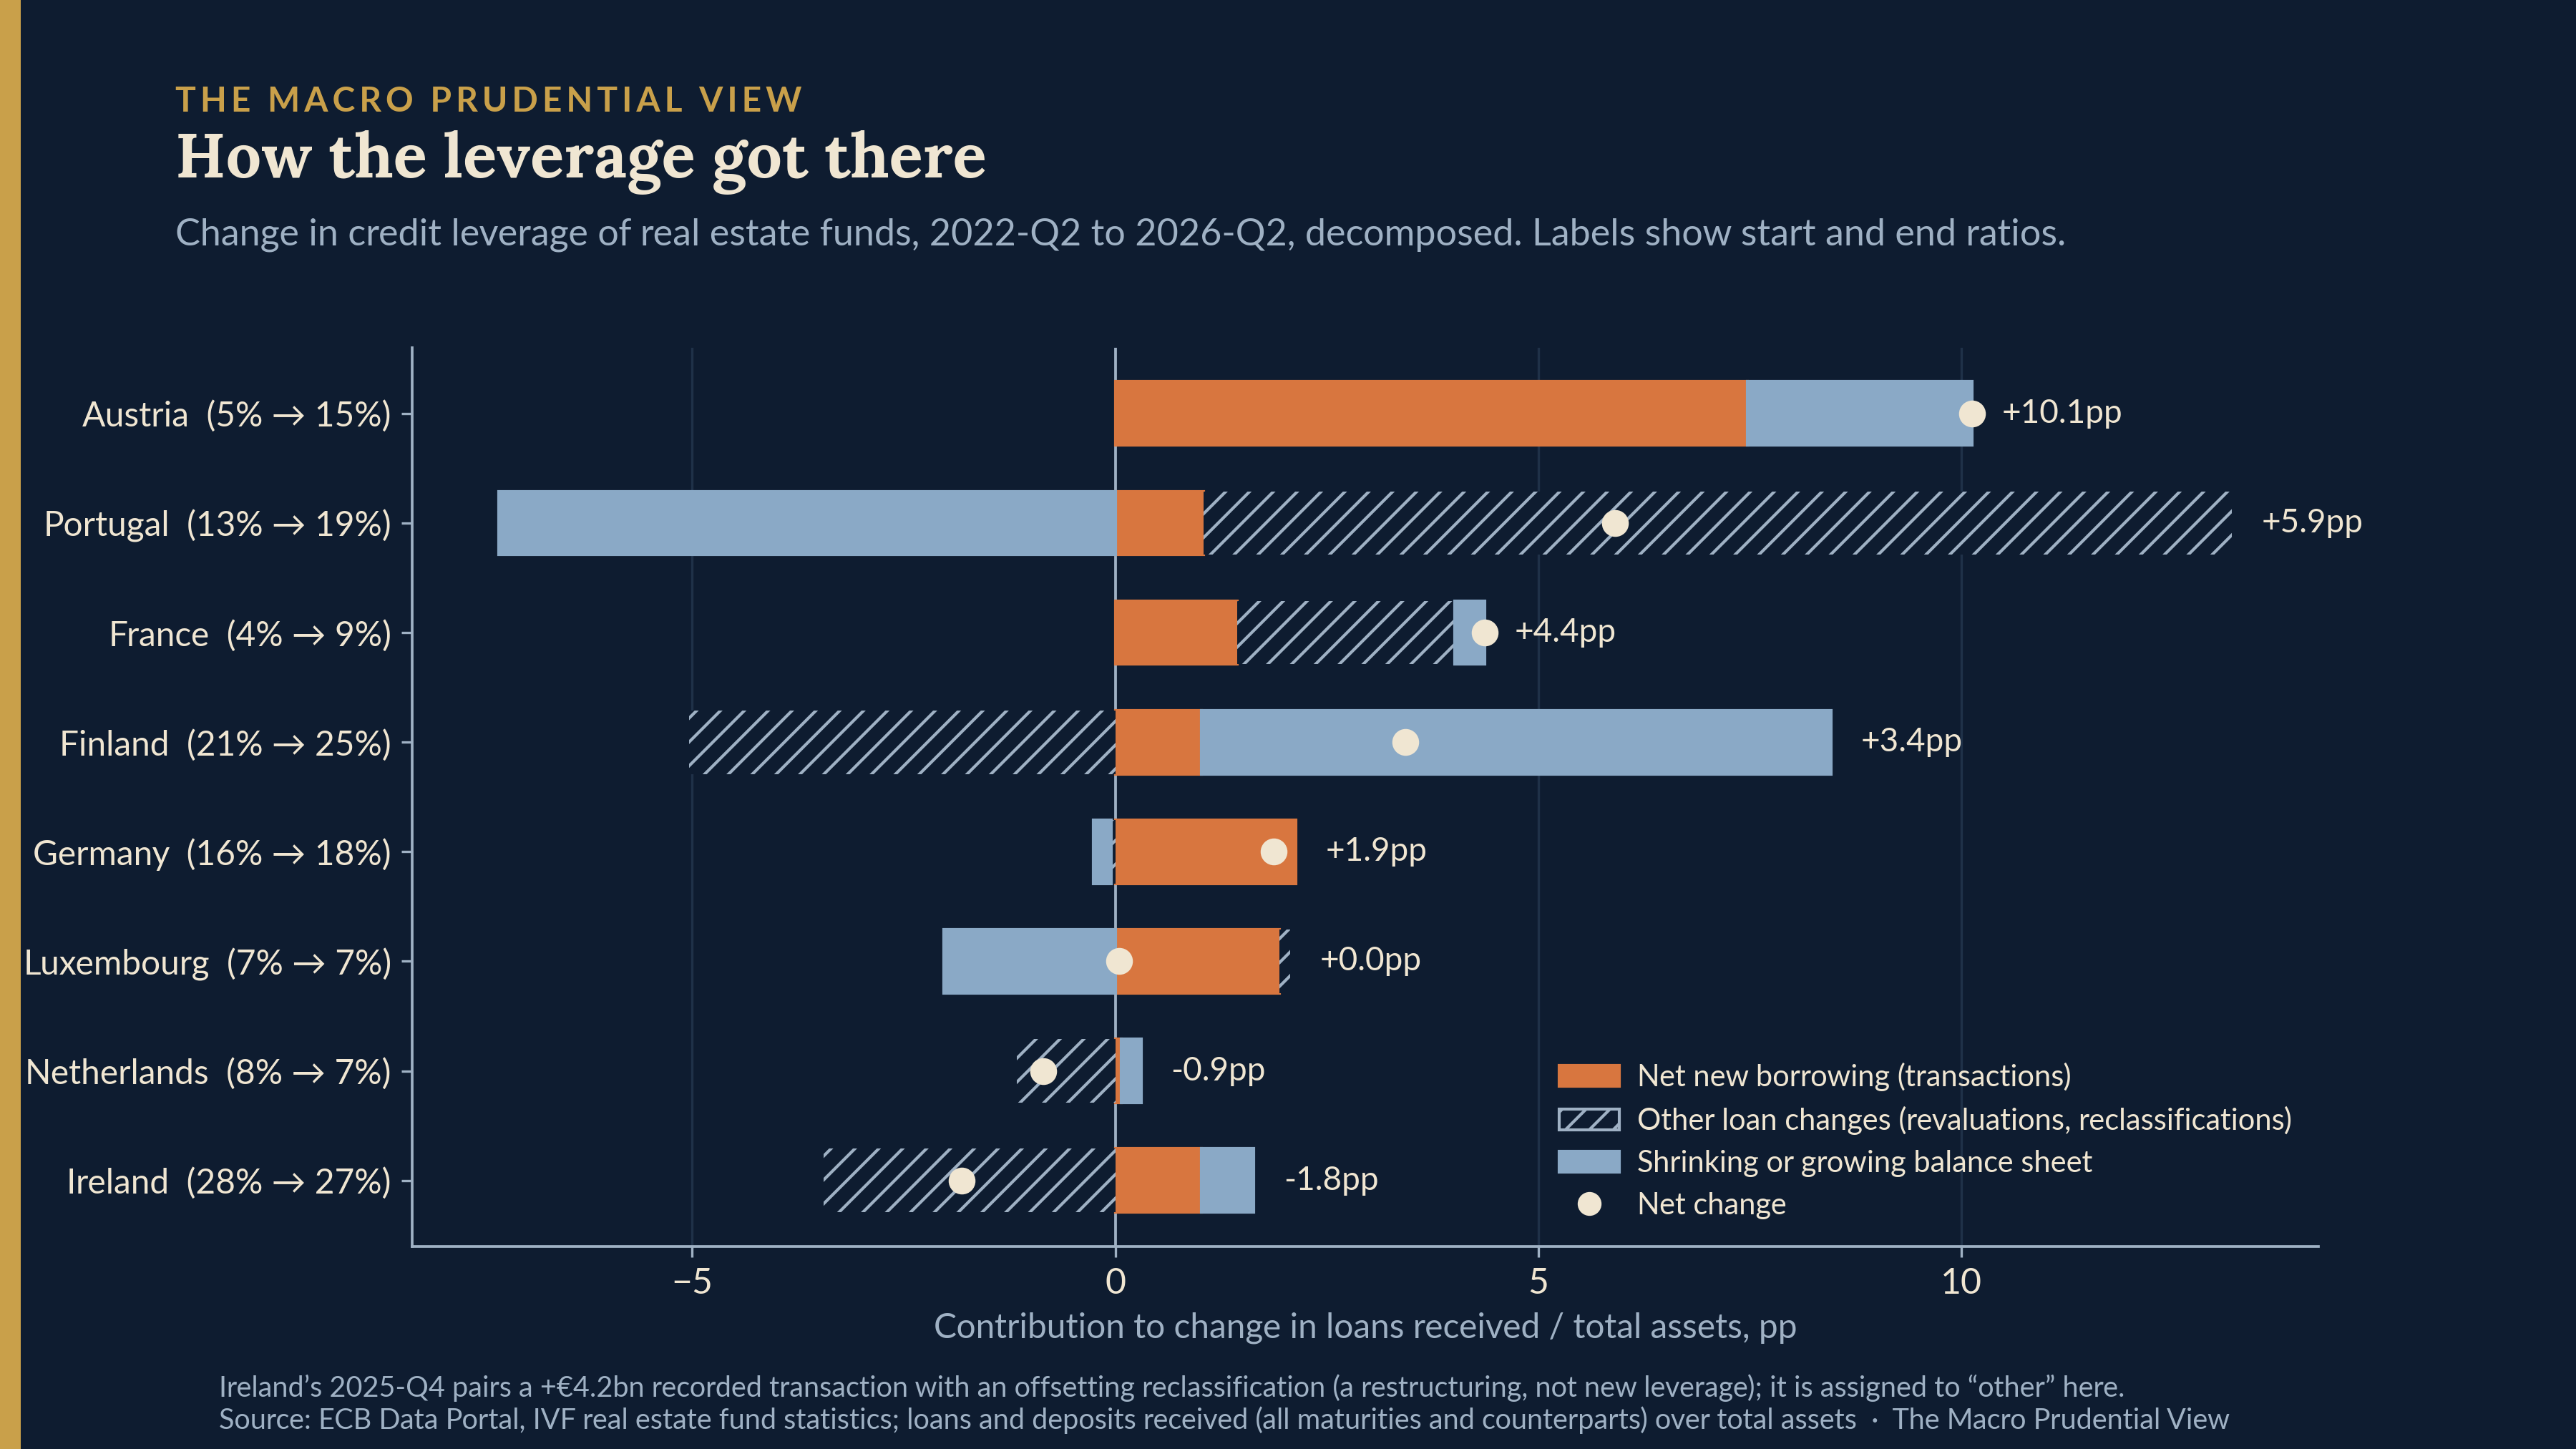
Austria borrowed. The sector’s loan stock rose two-and-a-half-fold between mid-2022 and its peak in late 2024, and the increase matches the cumulated net loan transactions exactly: all of it is new credit rather than a valuation or reporting artefact. The ratio had help — the shrinking balance sheet underneath contributes about a quarter of the ten-point rise, the borrowing the rest — but the numerator moved on transactions alone. Finland did the opposite. Its loan stock fell, but total assets fell faster — a mix of net asset-side transactions (roughly 40% of the ex-reclassification decline) and revaluations and other changes (roughly 60%) — so the ratio drifted up while the numerator shrank. And Portugal’s rise mostly is not a transaction story: 92% of the increase in its loan stock arrived without net borrowing, in jumps concentrated in fourth quarters — the signature of reclassifications and reporting-population changes rather than of funds levering up, an inference from the pattern, since the statistics do not label their adjustments; what the transaction split does establish is that the jumps were not recorded as net borrowing by the funds in the population — the borrowing history of whatever entered it is another matter. Portugal sits out the rest of this note. France is the mixture: roughly a third of its rise is net borrowing, with most of the remainder arriving through the same kind of non-transaction additions.
That leaves the interesting case, and a question I want to be careful with.
Vienna, quarter by quarter
Austrian open-ended real estate funds spent 2022 to 2026 in a redemption shock. Net fund flows turned negative in 2022-Q3 and stayed negative for every quarter since — €5.5bn of cumulative net outflows against a sector that started at €12.6bn of total assets. Gross redemptions climbed from around €200m a quarter to €423m in 2022-Q4 and €748m in 2023-Q4. In October 2023, LLB Semper Real Estate suspended redemptions; its management company gave notice in April 2025, and the fund has been in liquidation since 24 October 2025.
The sector’s borrowing moved over the same window. The loan stock went from €627m in 2022-Q2 to €1.6bn at its 2024-Q3 peak, and the quarterly pattern is worth stating precisely: net borrowing was largest in 2023-Q4 (+€361m), the quarter in which gross redemptions peaked and net outflows were deepest at once; the net increase equalled 53% of the quarter’s net outflows. That is a peak coincidence, not a lockstep — borrowing dipped in 2023-Q2 while redemptions stayed above €500m, then jumped in 2023-Q3 as redemptions eased. Two further facts sharpen the picture. The borrowing sits entirely in open-ended funds: closed-ended Austrian property funds report loans of at most €1m in any quarter on record, and one per cent of the sector’s gross redemptions over the period. And the lenders are almost entirely domestic banks, whose loans to the sector went from €429m to €1.4bn at peak and stand at €1.07bn of the sector’s €1.24bn total loan stock now, the stock declining since early 2025. The decline is net repayment — from the 2024-Q3 peak onwards, every quarterly change in the sector’s loan stock equals its net transactions exactly, leaving no room for a reporting-population break.
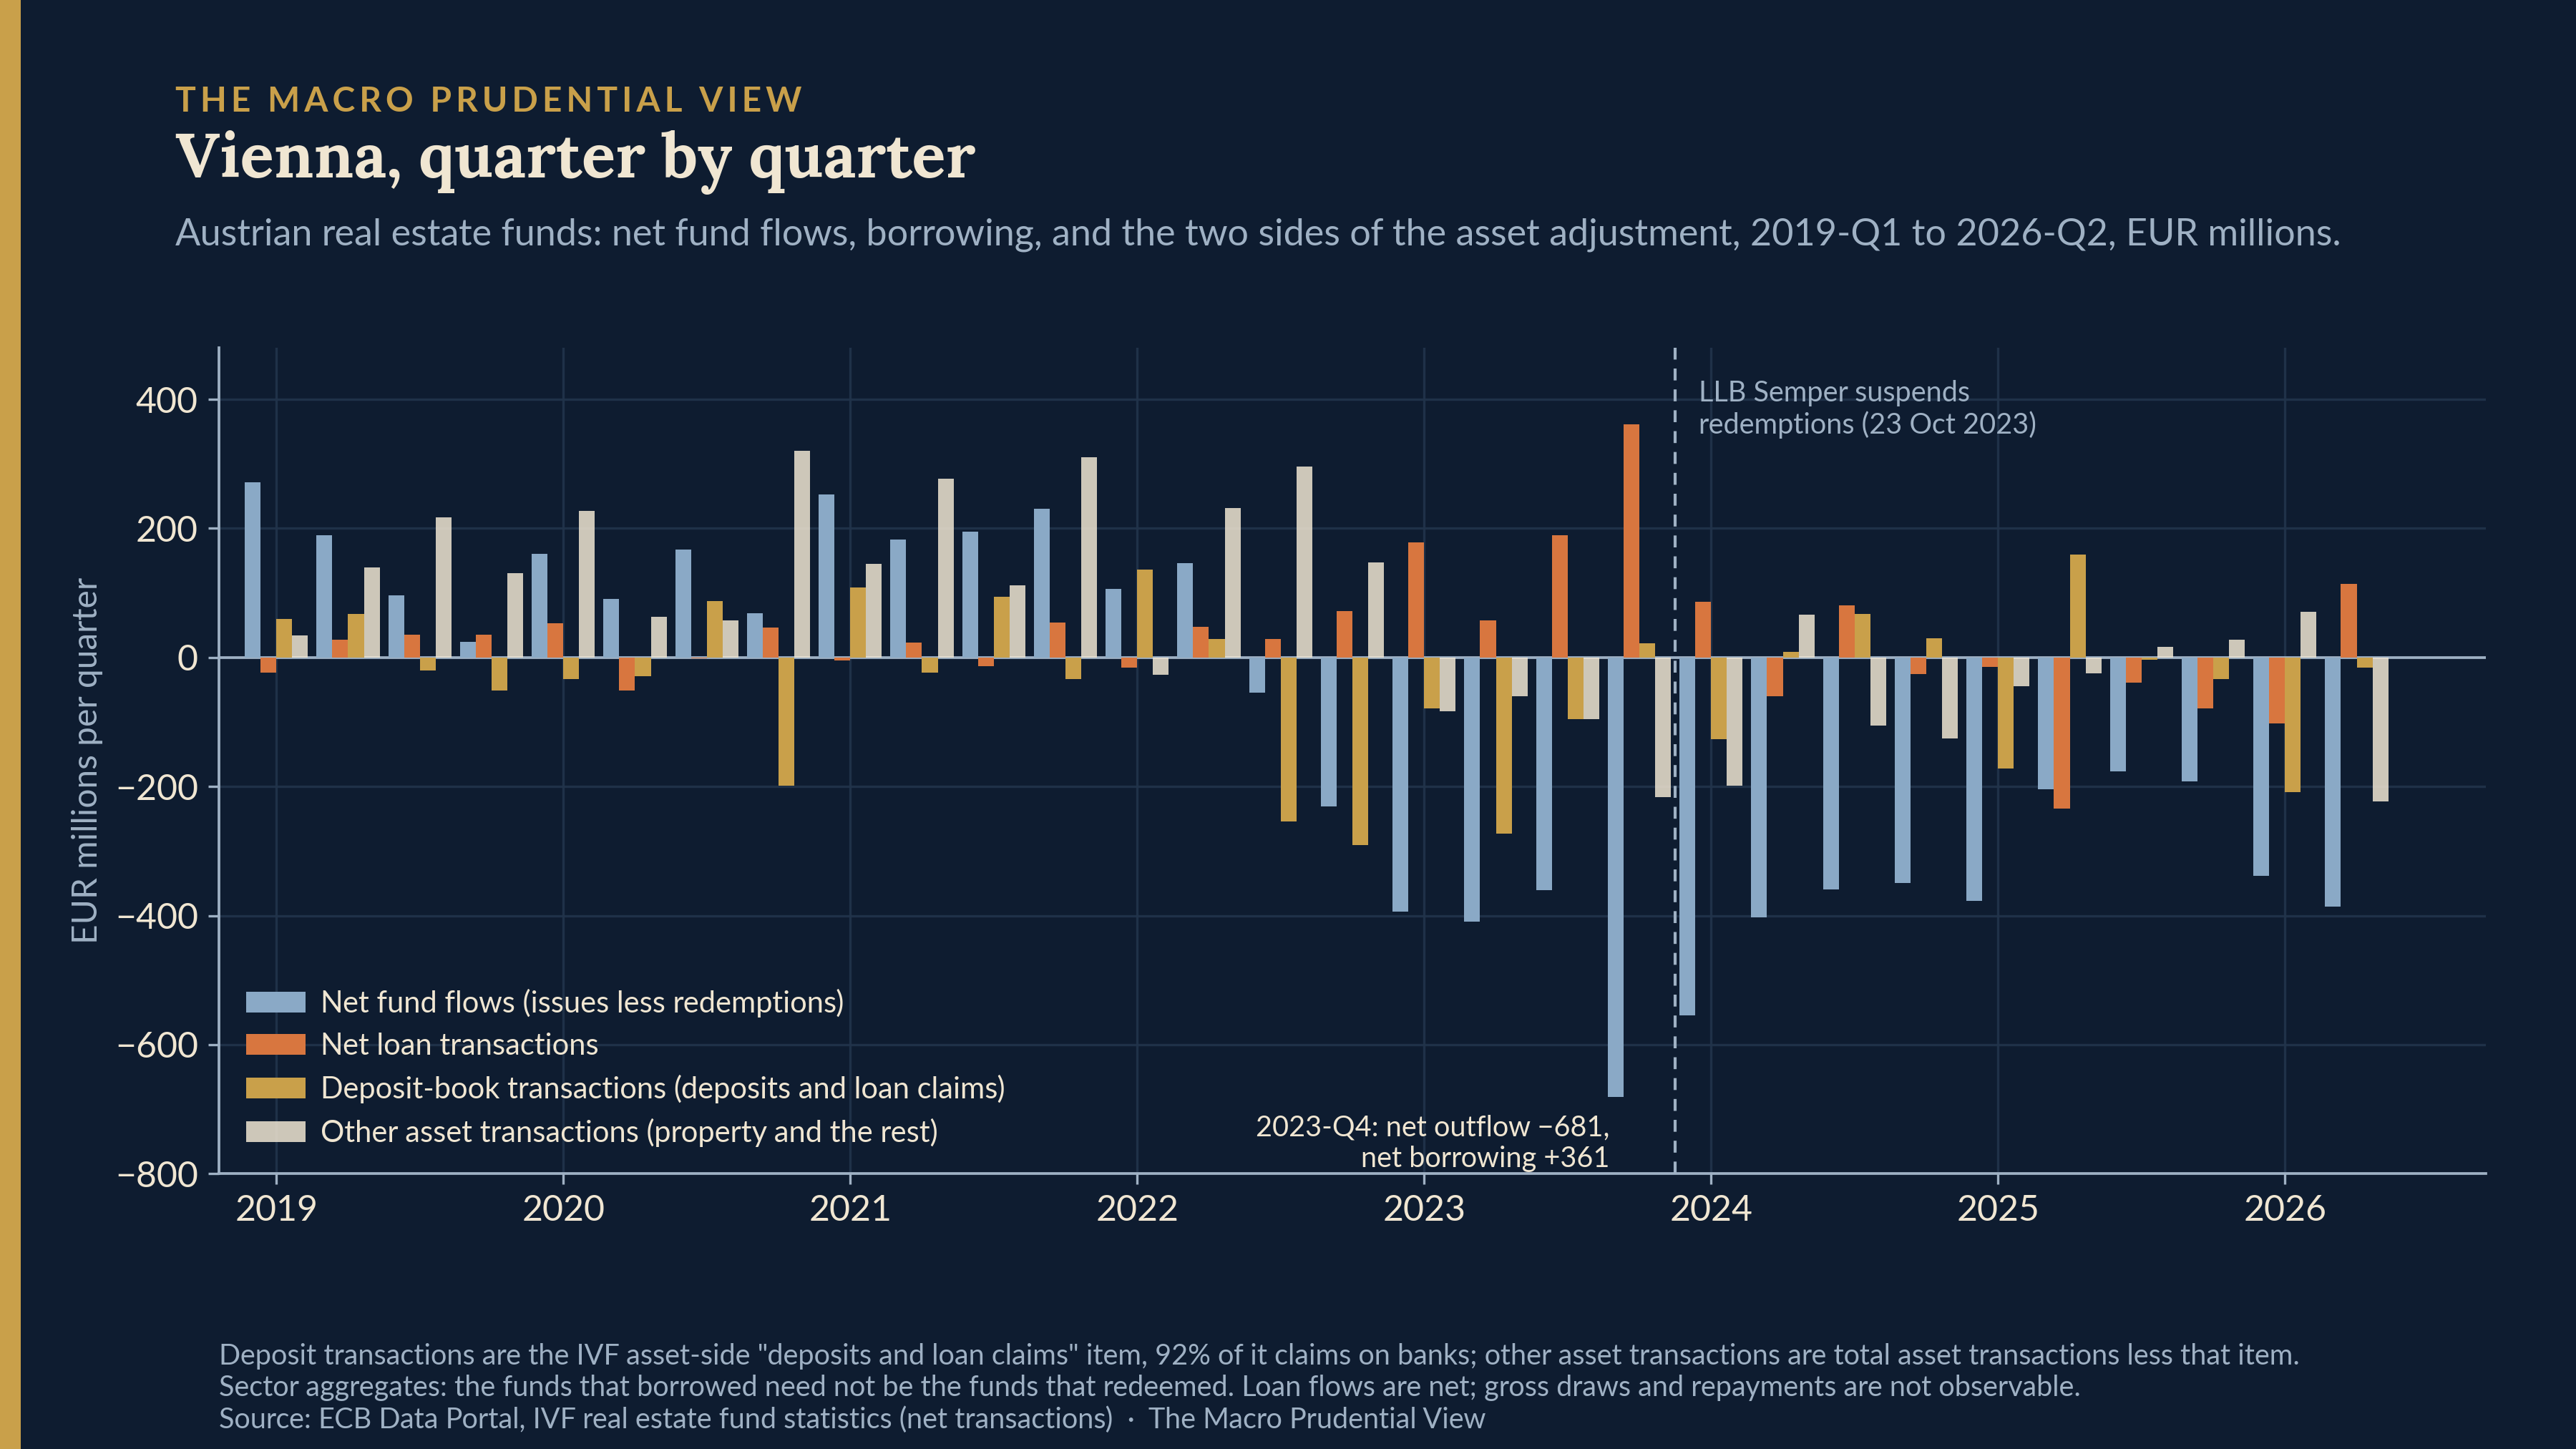
What these aggregates cannot say is what any of the borrowed money was for. The funds that drew credit need not be the funds that faced the redemptions; a sector series would look identical if unstressed vehicles borrowed for acquisitions, or took debt that had sat at property level onto their own balance sheets at refinancing — the years of the European property repricing were heavy with such rollovers — while stressed ones sold assets and gated. New net credit it is either way: the transaction match rules out mere repricing of loans already on the books. The timing, the open-ended concentration and the lender identity make the liquidity reading plausible, and it is the one I lean to — with a caveat the calendar forces: the best-known stressed vehicle spent the peak quarter gated, so the redemptions that peaked around it were mostly other funds’, and whose the borrowing was, the aggregate cannot say. They do not rule out acquisition or onboarding borrowing, and nothing in this note should be read as a claim about the use of proceeds.
What can be said turns out to close, once the statistics’ own conventions are respected. Net outflows of €5.5bn are the issues-less-redemptions measure, gross of the income the funds kept earning through the run. In the transaction accounts, retained income is booked as if paid to holders and reinvested in their units, so the shareholder outflow net of it — measured as transactions in fund shares — is €2.45bn; the roughly €3.0bn between the two measures is that retained-income adjustment, an accounting attribution, and nothing in this note treats it as a liquidity tool anyone reached for. It is on that measure that the identity closes to within €17m: the deposit book gave up €1.3bn — 92% claims on banks, 91% of it short-maturity — net disposals of everything else came to about €550m, gross sales and purchases unobservable behind the netting, and €614m of net new borrowing came in. Sizes of sector aggregates, not funding shares of any fund. Against the €5.5bn cash measure, borrowing is 11%; against the €2.45bn financial-account counterpart, about a quarter, with the deposit book near half — different denominators answering different questions, and neither a claim about use of proceeds. Two timing facts sit on top. The deposit book ran down early, some €900m of it by mid-2023, before net borrowing accelerated — though sector timing cannot show a single fund spending cash before borrowing. And the net borrowing was concentrated: equal to 53% of net outflows in 2023-Q4 — the deepest outflow quarter and the gross-redemption peak at once — 29% of cumulated outflows to the loan stock’s 2024-Q3 peak, and 11% over the window; the gross loan draws and repayments behind those net figures are unobserved. The path since is the shape a buffer would produce: the flexible instrument drawn hardest in the single worst quarter, then run down — fallen in six of the seven quarters since the peak, with a renewed €114m net draw in the latest. Whether that is a buffer working or something else is a hypothesis, and this note treats it as one.
One more discipline check belongs here. Across eight countries and twenty-nine quarters, no average contemporaneous relationship between property funds’ net borrowing and their net fund flows is detectable — the panel coefficient is indistinguishable from zero, though a null in eight clusters is weak evidence of absence — and in Germany and Finland the correlation is positive, borrowing accompanying growth rather than outflows. Restricting to outflow quarters produces the expected negative sign, though a split chosen that way is a descriptive exercise rather than a test. The Austrian episode is distinctive. It is a case, not a law.
The long view, and the boring case
Stretch the window back a decade and the cross-country picture reorganises itself around a different fact: since the shock, the jurisdiction with the highest-profile leverage policy has been the quietest line on the chart — quiet on the fund-balance-sheet series charted here, which for Ireland sits furthest from the total-debt measure its policy is written in, so this is a statement about the series, not about the policy variable’s path.
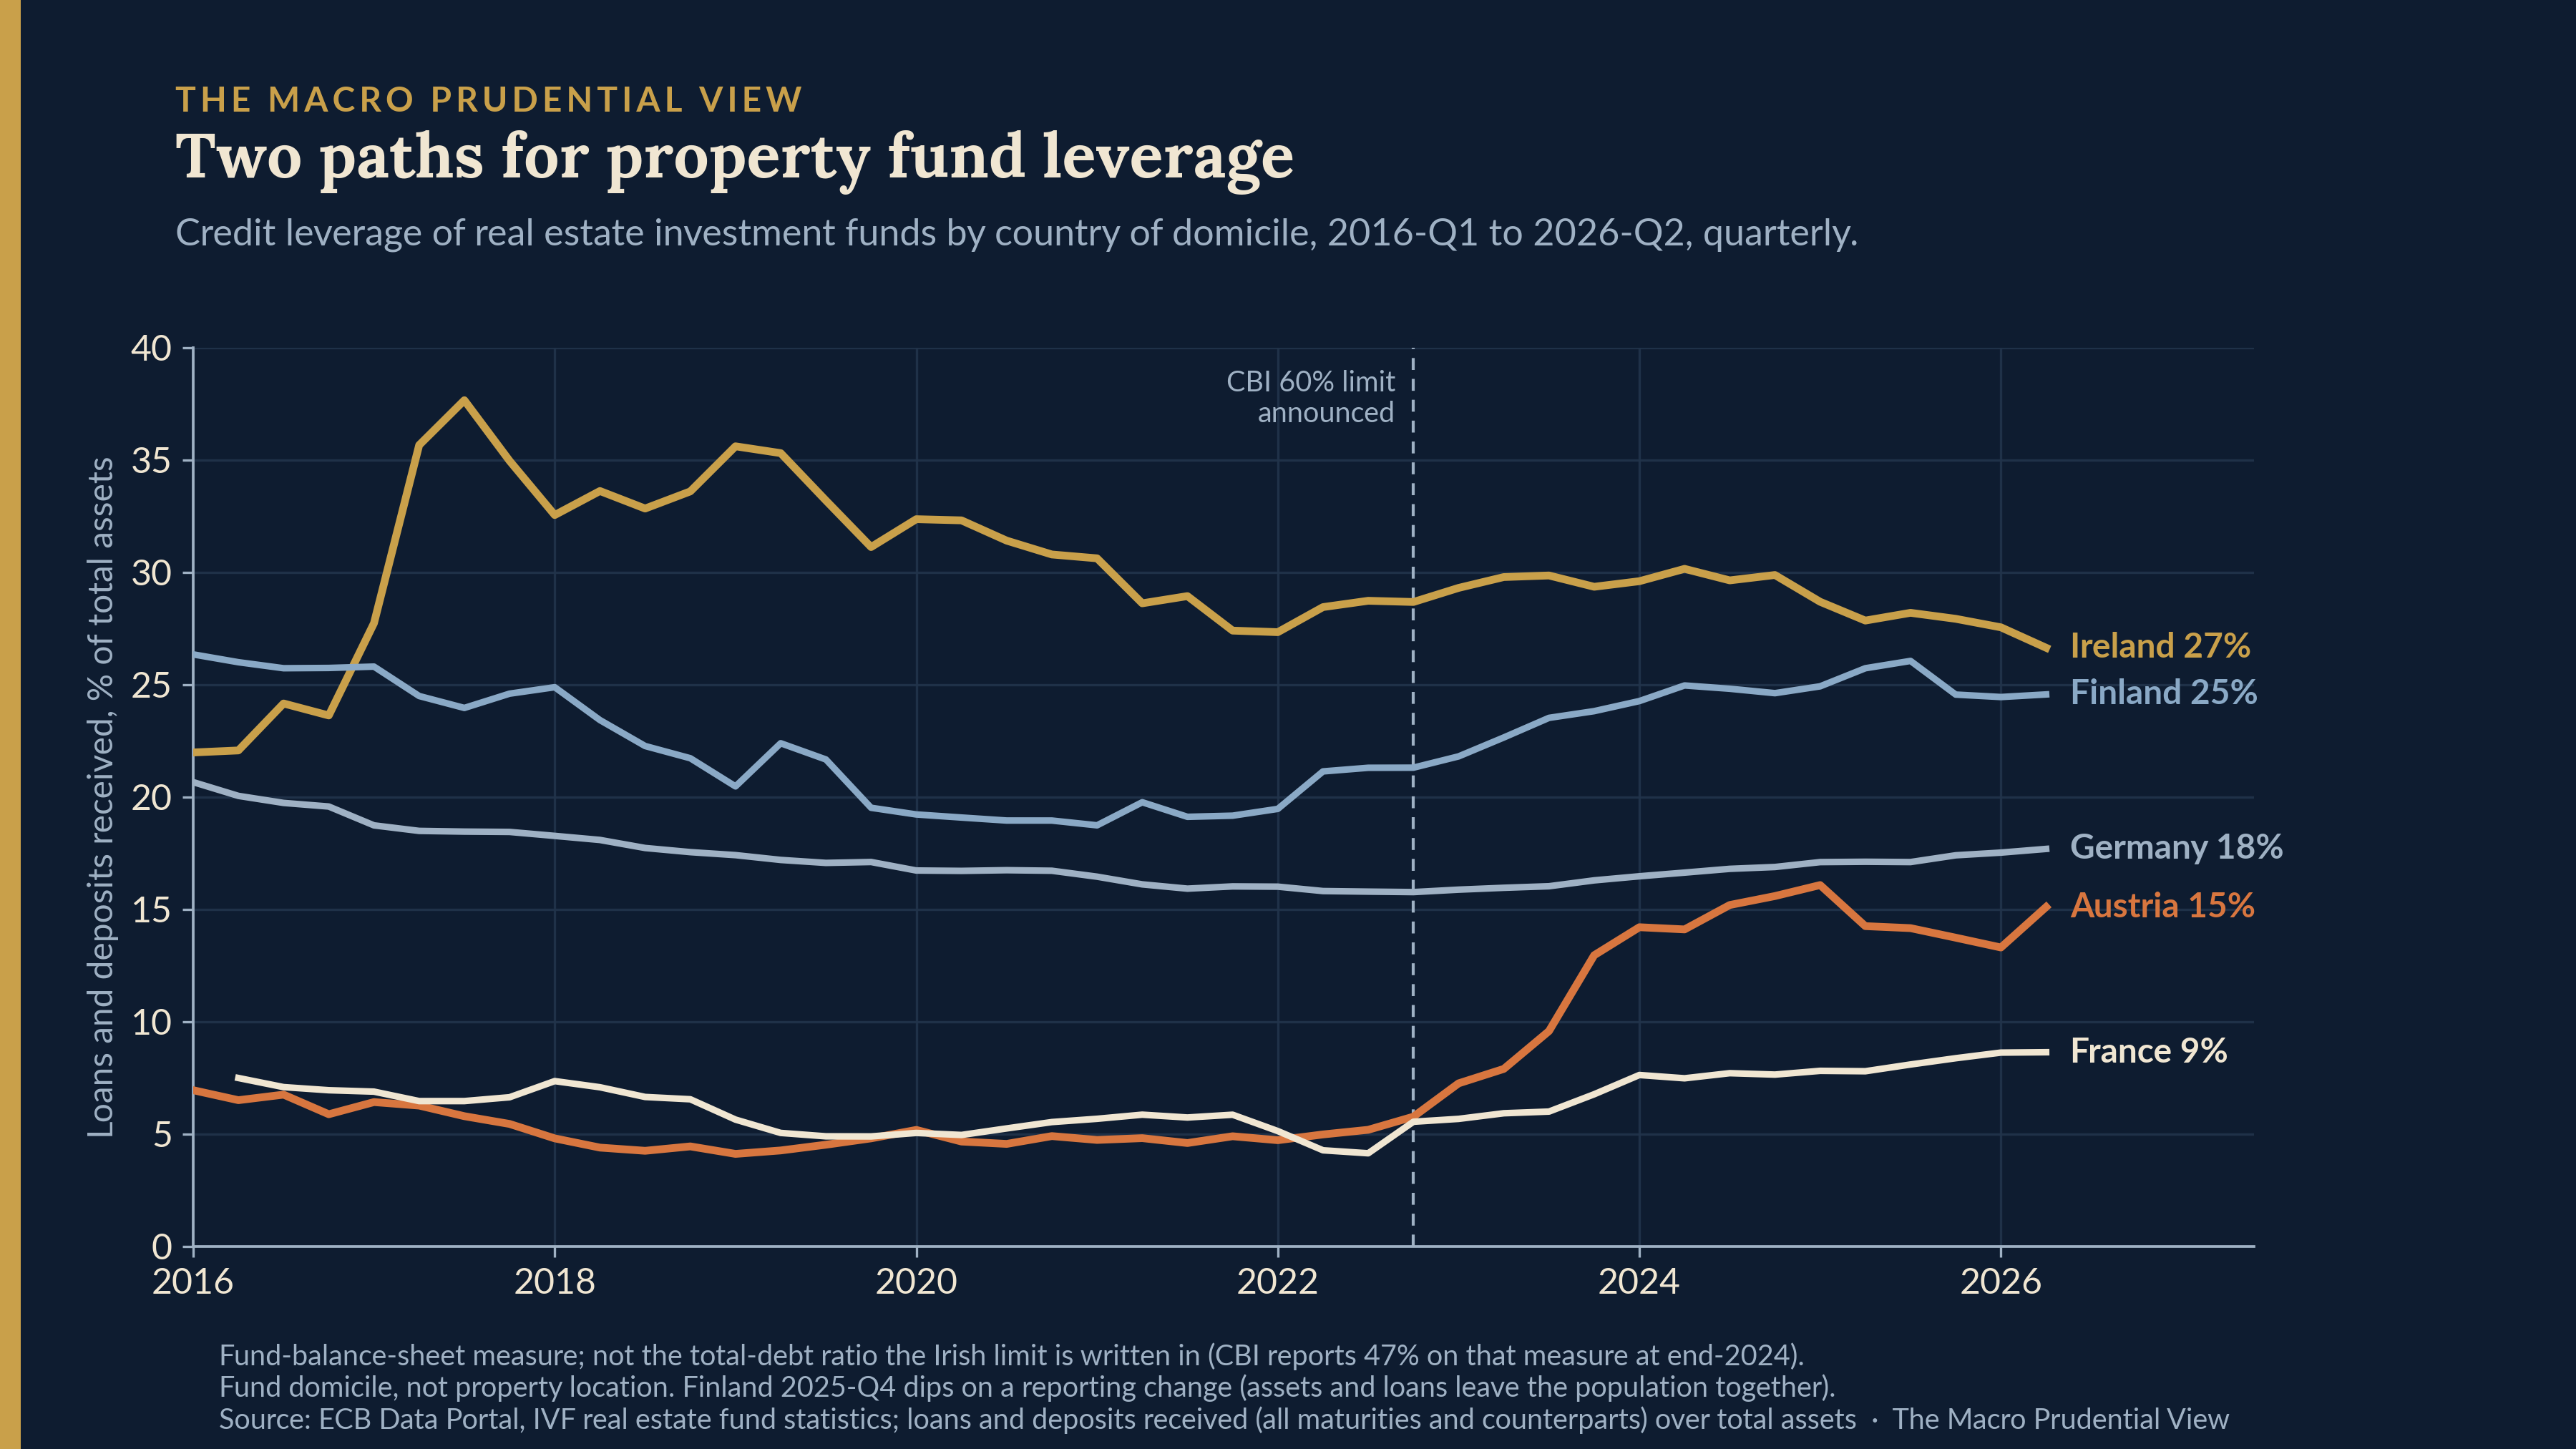
Irish property funds built their credit leverage in the mid-2010s — peaking at 37.7% of total assets in 2017-Q3, on the loans-and-deposits measure used throughout this note — and have been grinding down since, to 26.6% now. The decline predates the Central Bank of Ireland’s November 2022 measure by five years, so the chart is not evidence that the limit caused the deleveraging. What the measure did do, as I wrote in Ireland’s emerging macroprudential framework: two cases, one template, is codify a perimeter and a direction of travel: a 60% total-debt-to-total-assets limit for Irish property funds under Article 25 of the AIFMD, with a five-year phase-in that completes on 24 November 2027. Total debt is a broader concept than the loans and deposits charted here — shareholder loans have long rivalled bank loans on Irish property fund balance sheets — so the Irish line on the chart is not the ratio the limit is written in, and the two should not be read against each other. On its own measure, the CBI reports sector leverage of 47% at end-2024, down from 49% a year earlier: the gap between the two definitions, in one pair of numbers. The calibration was explicit about where it sat in the distribution — the CBI’s framework document notes the proposed limit “would lie above the 90th percentile of leverage across all EU real estate funds”, while the most leveraged tenth of Irish funds stood above 93% — and explicit about the pace, with the implementation period lengthened “to facilitate a gradual and orderly adjustment to the measures”. Ireland, in other words, made two deliberate choices: a limit above the bulk of the distribution, and a long adjustment path for the leveraged tail the limit was built to bind. That matters for how to read everyone else.
Austria’s line is the mirror image: a decade parked at 5%, then the near-vertical segment of 2023. Finland’s drifts up as the sector shrinks. Germany’s barely moves — 16% to 18% — but the level hides the largest absolute borrowing in the sample: German open-ended funds — an aggregate that nets retail outflows against Spezialfonds inflows, so none of what follows attributes to stress — added €9.2bn of net loans between mid-2022 and mid-2026, alongside €10.1bn of net outflows and asset-side transactions of −€6.5bn. I am deliberately not assembling those three numbers into a story. They do not form a closed identity (valuations, cash and other positions move too), and the German aggregate mixes retail vehicles with the institutional Spezialfonds that dominate it — roughly speaking, the retail funds tracked by Scope run some €95bn of fund assets on a NAV basis against the sector’s €433bn of balance-sheet total assets — different measures, but the mix rather than the ratio is the point, and the BVI’s segment statistics put the retail funds in net outflow for a second consecutive year in 2025 while the Spezialfonds continued to take money in. The asymmetry with Vienna is earned: Austria’s aggregate is a single vehicle class — the open-ended funds are, to within rounding, the sector — with an identified domestic-bank lender base and a loan stock that reconciles to transactions exactly, while the German co-movement is an artefact of the mix until the mix is split. Until that split can be done properly on one statistical basis, Germany is a set of components worth watching, and the note leaves it there.
What the caps actually say
Each of these jurisdictions writes a borrowing limit for at least part of its fund population, and the limits are less comparable than any cross-country chart implies — different numerators, different denominators, different vehicle populations. Austria’s real estate fund law caps borrowing and encumbrances together at 50% of the market value of the fund’s real-estate assets — the base excludes the liquidity portfolio. Germany runs two regimes: retail open-ended funds may borrow up to 30% of the value of their properties, while the Spezialfonds that hold most of the sector’s assets sit under a separate provision allowing property loans up to 60% of property value. Finland’s cap — borrowing of at most half of the fund’s assets, four-fifths for company-form rental-housing vehicles — was consolidated into its AIFM Act at the end of 2025, and the same amendment extends it beyond the company-form vehicles it grew up with: a special investment fund investing mainly in real estate must now observe the borrowing rule too, which brings the open-ended funds in the statistical population inside the cap. Portugal’s CMVM regulation sets 25% of total assets for open-ended vehicles and 50% for closed-ended ones offered publicly, with privately placed vehicles uncapped. France’s numerical cap — 40% of the property assets, plus 10% of the rest — applies to the retail OPCI segment; the SCPIs that make up much of the French retail population borrow under ceilings their shareholder meetings are required to fix, with no statutory number. Ireland’s 60%, alone in this list, is a macroprudential measure adopted under EU law rather than a product rule — the AIFMD itself imposes no numerical cap, and Article 25’s power to set one has been exercised for property funds by one authority; the only other uses recorded in ESMA’s leveraged-AIF assessments — Ireland’s and Luxembourg’s Article 25 restrictions on sterling liability-driven funds, written as minimum yield-buffer requirements — are a different instrument for a different problem.
I am not going to line these numbers up against the sector ratios above, because the comparison would be false precision: the ratios in this note are loans over total assets, and most of the caps are not — different bases, different populations. Nor can sector averages say whether any individual fund approached its own limit; averages can hide a distribution’s tail, and the distribution is not published. What is observable is narrower still: whether any single fund neared its own cap, no one outside the supervisory returns can say — and nothing here shows the statutory ceiling was ever the operative constraint, either: fund rules, lender covenants and credit supply bind long before a product-law maximum does. And the borrowing that did occur — in Austria’s case, raised hardest in the worst quarter of a redemption shock, the stock then falling in six of the seven quarters after its late-2024 peak — appears in none of these frameworks’ statistical or supervisory disclosures — the funds’ own annual reports are its only public trace.
The data that would answer it
Which is the point on which this note ends, because the question the Austrian episode poses is answerable, just not from where I sit.
What the borrowing did — cushion the funds, increase the banks’ exposure, or, in the way of secured lending, both at once — depends on facts that sit below the aggregates: which funds drew the credit, against what collateral, at what valuations, and whether the same funds faced the redemptions. Collateral, recourse and loan-level valuations are not public. Who borrowed and who bled largely is: Austria’s public-offer property funds are a handful of vehicles whose annual reports show borrowing and flows fund by fund, and assembling that layer — who borrowed, who bled, fund by fund and year by year — is the natural next piece of work, deliberately not attempted in a note built on the quarterly aggregates. What no assembly of public reports would yield is the cross-country distribution, and much of what would build that is collected, though not in one place or on one measure. Fund-level leverage flows to supervisors under AIFMD Annex IV on the directive’s own measures — gross and commitment leverage, rather than the ratios the national caps are written in; those sit, where they are collected, in national returns, as in Ireland’s Article 25 collection, whose aggregates are published. The ESRB’s 2025 NBFI Risk Monitor devoted a special feature to EU banks’ credit to real estate funds, drawing on supervisory data on bank–fund exposures that sits outside the published statistics. The distribution of distance-to-cap — the one chart that would locate the slack, fund by fund, and show how close anyone came to a limit — could in principle be assembled from what supervisors hold — how much joining of Annex IV returns with national collections it would take, and, for the caps written against property values, how much valuation data besides, only the authorities can say. On its own it would still leave the use of proceeds open; what it would do is replace inference about headroom with a distribution. To my knowledge, no one has published it.
There are observations worth naming in advance, as things to watch rather than tests that select a reading — because the readings are not mutually exclusive. Secured borrowing that met redemptions cushioned the funds and increased the banks’ exposure to the same property in the same motion; how much risk actually moved depends on collateral, recourse and loss incidence, none of which the aggregates carry. The things to watch are the loan stock’s path as the liquidations complete, Austrian banks’ provisioning against fund exposures, and whether drawn leverage persists once outflows end — the last of which could as easily mean property-level debt brought onto fund balance sheets as redemption funding. The record to date — a loan stock down in six of seven quarters, then a fresh net increase in the latest one — is short, commercial property valuations are still finding their level, and a note built on the distinction between what aggregates show and what they suggest should not end by blurring it.
The redemption side of this story — gates, notice periods and the rest of the liquidity toolkit — is its own subject, and one where the German record already has a published verdict (see Twelve years of evidence: did Germany’s OEIF macroprudential template work?); Austria follows the same route in 2027, when an amendment already on the books introduces a minimum holding period and a twelve-month redemption period for its real estate funds. The leverage side, on the evidence here, resolves into something plainer than a warning: the ratios moved for different reasons in different places, and only in Austria was new borrowing the main driver of the ratio — 11% of the window’s cash outflows, about a quarter of the financial-account outflow net of retained income, half of the single worst quarter’s. What remains open is not whether the slack was used. It is who it served, and the numbers that would tell us are already sitting in the returns.
Paweł Fiedor — The Macro Prudential View
Views are my own. This article is a personal analytical piece based on public sources. It does not represent the views of the European Systemic Risk Board, the Central Bank of Ireland, the Eurosystem, or any other institution.
Legal texts
ImmoInvFG § 5 — the Austrian combined borrowing-and-encumbrance limit, read with § 21 for the base.
KAGB § 254 and § 284 — the German retail 30% and Spezial-AIF 60% property-loan provisions.
Finnish AIFM Act (162/2014), ch. 16a § 6 and ch. 18a § 18, as amended 30 December 2025 — the half-of-assets cap and its extension to real-estate special investment funds.
CMVM Regulation 7/2023, Arts. 19–20 — the Portuguese 25% / 50% endividamento limits.
Code monétaire et financier, Arts. L214-39 and L214-40 — the OPCI 40% and 10% borrowing limits; AMF General Regulation, Art. 422-225, for SCPI borrowing ceilings.
Directive 2011/61/EU (AIFMD), Art. 25, and Delegated Regulation (EU) No 231/2013, Annex IV — the leverage-limit power and the supervisory reporting template.
Regulation (EU) No 1073/2013 (ECB/2013/38) repealed with effect from 1 December 2025 by Regulation (EU) 2024/1988 (ECB/2024/17), which governs the last three quarters of the vintage used here — investment fund statistics: solo, fund-by-fund reporting, which is why property-company debt enters the series only when onboarded.
Official reports
Central Bank of Ireland (24 November 2022), The Central Bank’s macroprudential policy framework for Irish property funds — calibration quotes at pp. 8 and 21 — and Financial Stability Review 2025:II for the total-debt leverage figures.
ESMA (May 2026), Annual risk assessment of leveraged AIFs in the EU — the Article 25 inventory, pp. 12 and 22.
ESRB (September 2025), EU Non-bank Financial Intermediation Risk Monitor 2025, Special Feature 2.4.
OeNB, Financial Stability Report 49 — the Austrian redemption wave and the 2027 holding- and redemption-period amendment.
LLB investor information — the Semper Real Estate suspension, termination and liquidation dates.
BVI segment statistics for the German fund flows; Scope Fund Analysis for the German retail-fund volume (NAV basis).
Data
ECB Investment Fund Statistics (IVF), 2026-Q2 vintage — all balance-sheet series: loans and deposits received (stocks and transactions, all maturities and counterparts), total assets, fund-share issues, redemptions and transactions, and asset-side deposits and loan claims; the open-end/closed-end split uses the IVF sub-sector series (4A/4B). The leverage numerator is the liability item “loans and deposits received” as reported on fund balance sheets — investment funds take no deposits in any ordinary sense, and 86% of the Austrian stock is owed to domestic banks, so the text calls it loans.
Calculations. All decompositions, reconciliations and shares are computed by The Macro Prudential View from the IVF series. Chart 1’s decomposition is exact and additive: Δ(L/A) = F/A₁ + (ΔL−F)/A₁ + L₀(1/A₁−1/A₀), with F the cumulated net loan transactions; no residual. Net fund flows are the IVF net-issues measure; measured as ESA transactions in fund shares — which treat retained income as reinvested — the Austrian shareholder outflow is €2.45bn, which is how the identity in the text closes (residual €17m); the €3.0bn between the two measures is the retained-income imputation (ESA D.443), a statistical attribution rather than an observed cash flow. The panel estimate regresses quarterly net loan transactions on net fund flows, both scaled by lagged total assets: eight countries (Italy excluded for semi-annual reporting), 2019-Q2 to 2026-Q2, country fixed effects, standard errors clustered by country; with eight clusters the t-statistics are indicative, so the null was re-checked with time fixed effects and an exact wild cluster bootstrap (p≈0.4 either way), and lagged fund flows at one and two quarters show no relationship either. Series keys, per-pull checksums and all computations are in the article repository; working files available on request.